
CAPTO Golf Gen 3 is a premium putting performance analysis system. This is a tremendous value for coaches or serious players. Let’s take a look.
There are only a couple systems like this in the world. This one is the most affordable and can be used indoors and outdoors.
CAPTO Gen 3 is the full or premium version.
They also make a scaled down less expensive version called the CAPTO EZ.
I highly recommend the CAPTO Gen 3. ★★★★★
What is the CAPTO Gen 3? Simply put, it’s like Trackman for putting. The hardware and software are amazing.
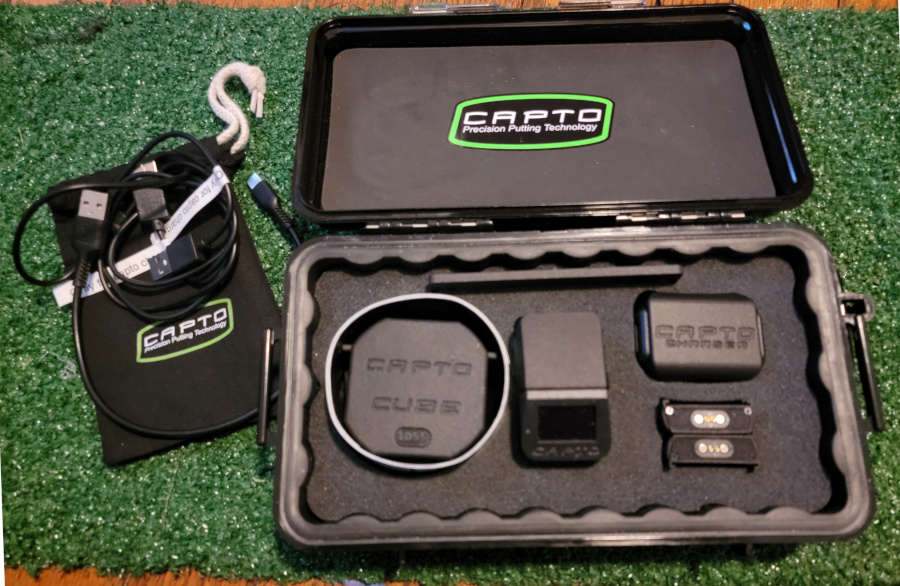
What’s in the box?
From CAPTO Golf
CAPTO Gen 3
The Capto Putting sensor is designed to be lightweight and easy to use. The sensor along with the App are the core of the Capto Putting System. Install it on the putter, launch your app and you are ready to go!
Set includes:
- Capto sensor
- Capto Cube (for calibration)
- Battery Charger
- 3 Interchangeable Batteries
- One year annual software subscription
- One target bar
Bundle includes:
- Everything in set +
- Certifications
Note: I bought the “bundle” because of the certifications. The purchase includes the training you need and you must pass tests to achieve certification. The extensive training is in video format and can be reviewed after completing certification.
Combo includes:
- Everything in set + Bundle +
- Capto EZ
Here is my take
I’ve been using this system for more than a month now.
I’ve completed the Level 1 and Level 2 certification courses and plan to offer performance analysis.
The system contains multiple items, but has two main components.
One is a lightweight computer like device / sensor that attaches to your putter shaft and the other half is the performance analysis software.
I was concerned about the weight of the device on the putter shaft. It’s not really noticeable and feels somewhat like a counter balance weight if anything.
The sensor / computer has a small screen that faces up so you can see it. The maximum number of metrics or data points shown on the that screen is 3 items. Example: Face angle change, Loft at impact and Lie at Impact.
The software is a whole different story. It displays over 40 performance items in numeric and chart format.
The system connects via Wi-Fi. The sensor has Wi-Fi built into it so you can take the device anywhere.
It can work as a stand alone unit also..
What does that mean? The sensor can store all your putt data and it will load onto you phone, iPad, or computer the next time you sync the two devices. The other option is to take a computer, phone or tablet with you and the software or app displays data real-time.
I think it’s the best portable option on the market.
Key selling points were not only the price, but the ability to use it outside on the practice green or even in play on the course.
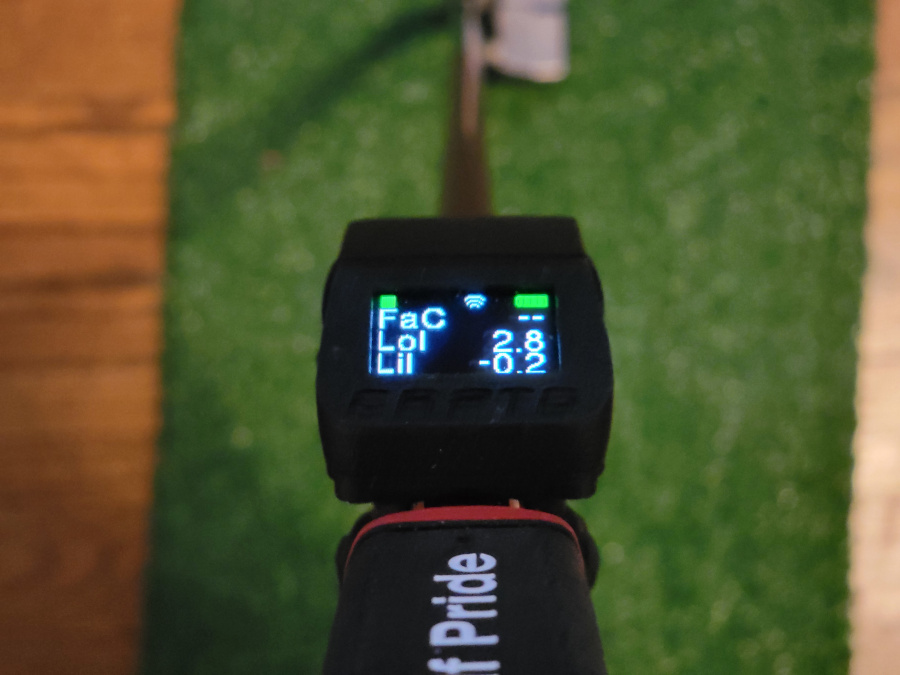
At set up, Face –, Loft 2.8, Lie -0.2
All 3 change to impact numbers after the stroke
What we track
- Putter Aim
- Face Angle
- Shaft Angle
- Putter Loft
- Putter Path
- Putter Track
- Angle of Attack
- Putter Arc
- Low Point
- Rotation Plane
- Sweet Spot Plane
- Sweet Spot Track
- Sweet Spot Rotation
- Putt Kernel
- Handle Track
- Stroke Radius
- Strike Location
- Ball Launch Height
- Ball Launch Direction
- Putter Speed
- Putter Acceleration
- Stroke Time
- Stroke Length
- Stroke Tempo
Screenshots
Note: The settings for GREEN / GOOD values or threshold levels can be set for beginner, intermediate and advanced. You can keep track of individuals, their performance and their putters in the setup.
The screenshots that follow are just to show the depth of analysis for coaches or players that really need the data.
In my opinion, this is too much for the average student to see during an evaluation.
In a coaching environment, I would suggest focusing on one or two things.
I focused on 4 for years. Those would be Face angle change, Loft change, Lie change and Tempo.
The big difference with CAPTO GEN 3 is that you input the actual loft and lie values for the putter being used as well as other measurements into the putter setup.
That means you are measuring against known values.
Why is this important?
I have another system that measures the same changes.
That system just displays the individual metric changes during the putt.
However, you really need to know the actual values at impact.
There is more on this below.
LAB MODE
Here is a screenshot of some of the data you get with CAPTO. Take a good look at the LOFT tile in the image below.
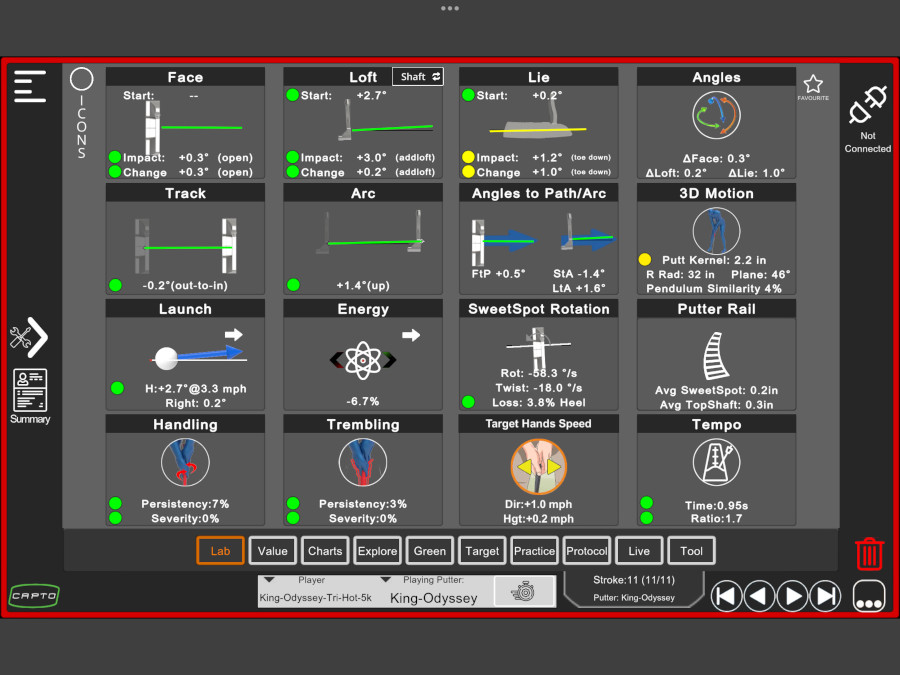
LAB VIEW – ONE OF TEN TABS
Without going into the weeds or too much detail, let’s compare my LOFT numbers from two different systems.
My putter has 3 degrees of loft.
• The old system I used indicates that on my last 75 putts my loft change averaged +1.5 degrees. One could assume that means my dynamic loft or loft at impact would be +4.5 degrees. (3+1.5=4.5)
That’s not the case. Go back to what I said above…+1.5 from what number???
• With CAPTO GEN 3 my dynamic loft reads +3.1 degrees at impact.
Why is that?
The fact is, I forward press as a putting trigger. The forward press is about minus 1.5 degrees. However, I add 1.5 degrees of loft at impact.
That means the actual loft at impact is around 3 degrees. (3-1.5+1.5=3)
This isn’t a great result, but most everything is in the green for the intermediate settings.
Value Mode
This is a screenshot of the VALUE tiles I use when practicing. It’s probably too much at once.
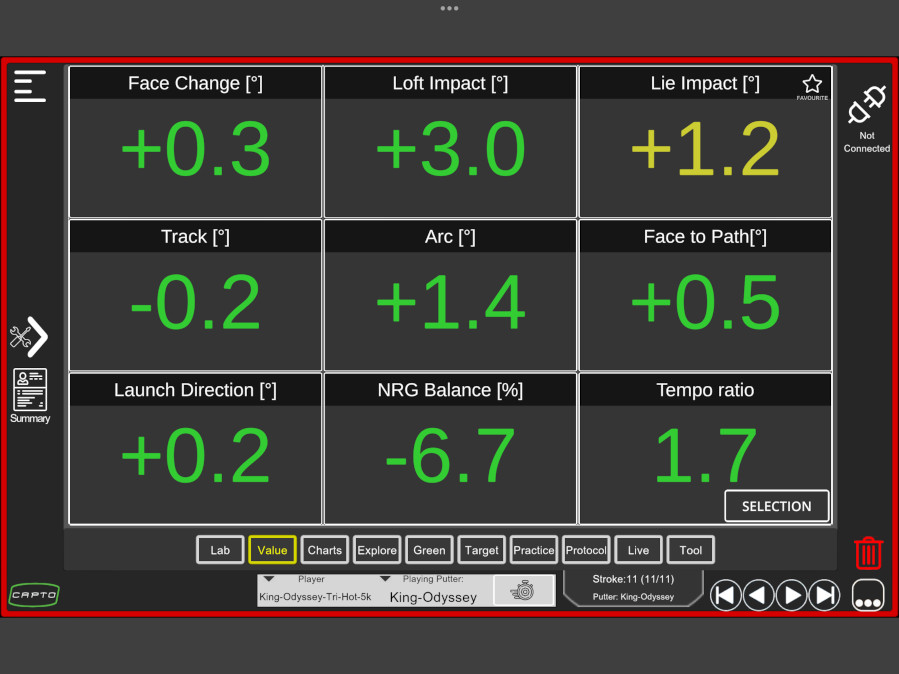
VALUE TAB – NUMBER 2 OF 10 TABS
If I was working with a student, I would chose just the needed focus tiles.
For example: Face change during the stroke to work on getting it within plus or minus 0.5 (Where it needs to be to make 10 foot putts)
I might use Face Change, Loft Impact and Lie Impact for practice.
For a more advanced player, I might use Face Change, Loft Impact, Lie Impact, Track, Arc and Tempo Ratio.
How do I read the info above?
Again without getting into the weeds or too technical, it’s a pretty good putt. It also went in the hole from 10 feet.
What could be better?
What sticks out to me is the NRG Balance (Energy Balance). While it’s in the green, it still a minus number.
By clicking on the NRG Balance tile, you can see factors that cause energy loss. They are “Torque,” “Top /Back Spin,” and “Side Spin.”
What I’m working on is making sure I strike the ball in the sweet spot of the putter.
The data above shows I hit the ball toward the toe causing an energy loss.
Energy loss would mean you most likely leave the ball short. Using a high MOI putter like I have helps, but does not cure the problem.
From the first screenshot above, my launch angle is 3 degrees. I’d like to get that under 2 degrees. My average is 2.7 degrees. In fact, it’s something that is fairly easy to correct.
Conclusion
Why did I get this?
The closest data driven putting / full swing lessons or evaluations are not close for me.
So, I bought a full swing launch monitor and a putting performance analysis system for myself.
My intent is to give putting lessons locally.
I feel if you aren’t measuring what you do in golf you are guessing.
The CAPTO GEN 3 delivers the data you need to take your game to another level.
Note: If you have questions for CAPTO, contact them. Their customer service is excellent.