
For the last year or so, I’ve collected quite a few putting charts & diagrams. This article is an effort to make them available all in one place. I’ve added several “new” diagrams as well. I hope you find them helpful.
Overview
Putting: Charts & Diagrams are somewhat frustrating to research.
There are tons of people out there on video or online suggesting swing theory. There is a lot less information on putting.
Break charts seem to be less accessible. It may be because green reading is not an exact science.
I’ve found significant differences in suggested amount of break to play in some charts. Fair warning.
The real test is to go to the course and practice. Make notes for yourself regarding “your green reading.”
Chart Concerns
Here is an example: I have a putting mat on my front porch. It’s six feet long. It breaks 2 degrees or 3.5% left to right.
I have a chart that suggests that I play 16 to 18 inches of break. I have another chart that suggests I play 6 inches of break. How can that be? Which one is correct?
On that putting mat, I play somewhere between 8 and 10 inches of break regularly.
To Verify the Break
If I lay down two tape measures on the six foot mat, here is what I measured.
Based on putting expert Phil Kenyon’s 2/3 trajectory rule the putt breaks between 8 and 10 inches.
How to measure?
I know where the aim line and aim point are after hundreds of putts.
Using tape measures, I laid out a straight line to the hole and to the known aim point. Then, I looked at the putt to determine trajectory at the 2/3 point of the putt or 4 feet. Measuring from the baseline to the perceived trajectory, I came up with 4.5 inches.
Now, double that. The aim line is 9 inches above the hole. I prefer to say 8-10 depending upon the speed of your putt.
Just be aware that no chart is perfect. Conditions change. Measuring sometimes depends on the conditions, speed of the green, the individual, etc.
Useful Links
Here are measuring devices or apps for break. Digital Green Reading
You may want to look at our article on Mapping your course or greens
This article may be helpful for those who have a course mapped by Strackaline. One of the courses I play has mapped their fairways and greens.
Conversion from Degrees to Percent
The hard way: Example for any angle in degrees:
Type this in at Google…. tangent of 2 degrees x 100
Result: 3.49207694917 or 3.5%
The EASY WAY – there are free calculators online to convert… degrees to percent and percent to degrees of slope.
Here are two charts I made up. I use degrees, but included percent as well.
Slope Chart PDF – Slope in Degrees up to 4 degrees and 7 percent (4 degrees is a lot)
Slope Chart PDF 2 – This one goes farther as I have more than 4 degrees or 7 percent slope on the greens at the course I play on. The chart goes up to 9 degrees or 15.84 percent.
Putting: Charts & Diagrams
If you really want to get into the weeds on breaking putts, I’ve included a copy of the “Slopes and Break” PDF from Geoff Mangum’s PuttingZone (I read it. Not all of the links work, but the text makes sense) He has his own opinions like everyone. There is valuable information in the document.
Here is another deep dive into what is fair as far as slope is concerned. In other words, where is a fair location for pins on a green.
Putting Green Speeds, Slopes, and “Non-Conforming” Hole Locations This is an article in PDF format by Jerry Lemons.
What is a fair hole location? Fair Slope Chart PDF This chart shows what would be fair based on the speed or stimp reading of a green.
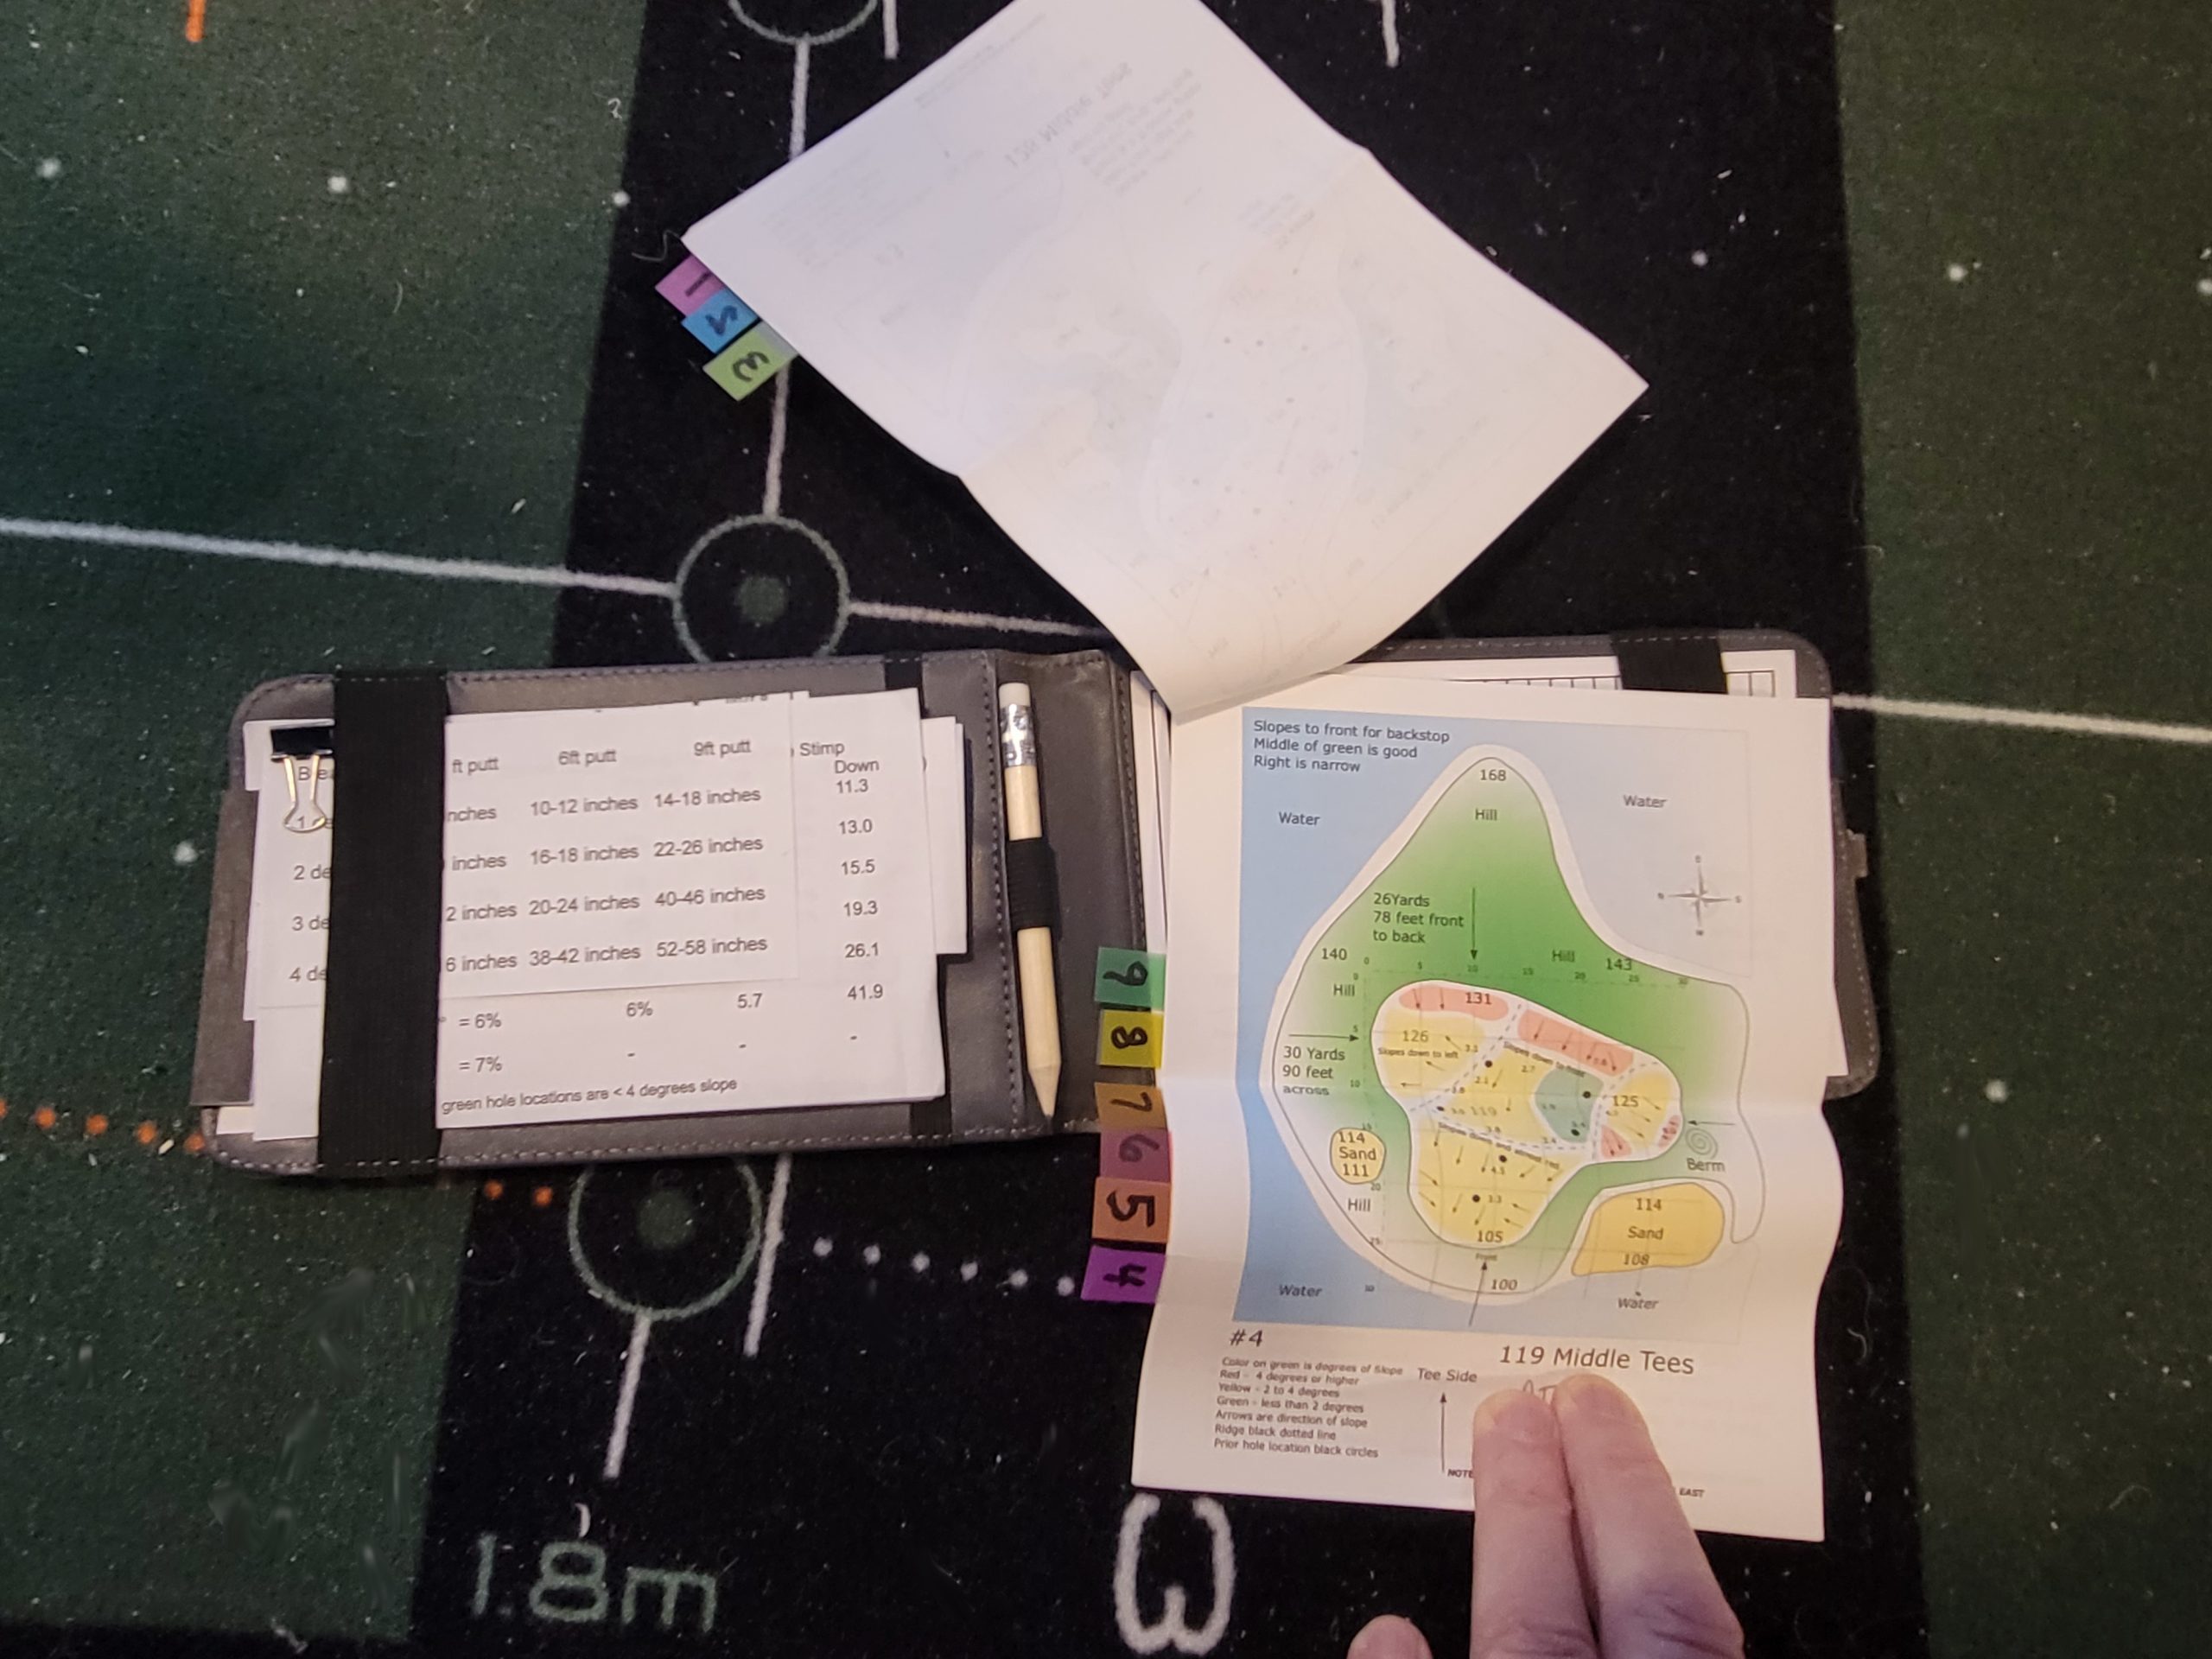
Charts I carry
I carry several Putting: Charts and Diagrams in my yardage book / scorecard holder. These are for practice rounds or the practice green.
I have green maps instead of a yardage book because my home course is all par threes. The green maps do have yardage from the various tees.
Club Yardage Chart PDF – This chart gives me yardage by club for a 100%, 75%, 50% and 25% swing. The wedges up to middle clubs are most important to me. Some players put tape on each club with these measurements written on it.
Slope Chart PDF – For 1 degree, 2 degrees, 3 degrees and 4 degrees from 3 feet to 30 feet.
(Note: I also carry slope charts for 10 stimp and 11 stimp greens from 2 feet to 60 feet.)
The10 and 11 stimp green charts are not public charts. They come with my subscription to Tour Read Golf / Tour Read App for iPhone or iPad. They offer advice, drills and charts, etc. The app reads break for you and gives you suggested pace and the aim point.
I made my own Excel spreadsheets / Cheat sheets based on info from the app. I don’t carry the iPad on the course.
Effective Stimp
Whether you are putting uphill or downhill changes the “effective” stimp of the green.
Effective Stimp Chart PDF – This is for a 10 stimp green. It includes slope up to 4 degrees or 7 percent and shows effective stimp for uphill and downhill putts.
Effective Stimp Chart PDF 2 – This one is uphill and downhill effective stimp based on rise and slope percentage compared to body parts on a 6 foot tall person. It’s easier than doing math.
For example: If the putt is uphill to my knees, I need about twice the pace. This takes some practice, but it’s easy to remember.
Other Putting: Charts & Diagrams
Reading break / Where to aim
Where to direct your attention PDF – For players that use a linear putting method.
Where to direct your attention PDF 2 – For players that use a non-linear putting method.
Putt Geometry 1 – Speed vs Line – Play enough break
Putt Geometry 2 – Two thirds method of finding your putt start line / aim point
Perfect Putt Diagram
0.0 degree metrics at impact PDF – This is a diagram explaining the elements of a perfect putt.
Aim Point
Effective Stimp Chart PDF – This chart is from AimPoint Golf. It’s widely available publicly. I find AimPoint to be tedious and time consuming. Others swear by it.