
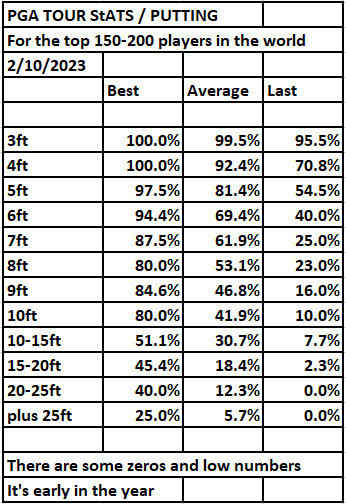
2021 PGA Tour putting stats really can tell a story. These are the top 200 players in the world. So what is this putting resources chart all about. Compare your stats to the best.
I look at the “last” column and try for those stats.
Practice all length putts, but mostly 20 feet and in to score better. Practice longer lag putts to avoid making 3 putts.
You may want to take a look for more putting resources and stats at the PGA Tour website.
Never up, Never in versus Lagging
There are two theories. The “never up, never in” theory and the “lag” theory. I use the “never up, never” in theory from 20 ft. or closer and the “lag” theory for putts longer than 20 feet.
A good suggestions is to set up practice putts of 3 ft., 6 ft., 10 ft.,15 ft., 20 ft., 30 ft., and 40 ft. or farther using red divot repair tools or tees. I don’t putt them in order and vary the distance.
Putt the same golf ball or 3 golf balls from each position and then remove the marker to tell which distances have been completed.
Putt in both directions to a 6 foot diameter circle made from white ball markers or tees. I have a 3 foot piece of string and a tee to lay this out with. The object is to make the putt or to end up with a 3 foot putt or less.
For putts you miss, some people will suggest that you leave the ball 1 foot from the hole on a 10 foot putt, 2 feet from the hole on a 20 foot putt, 3 feet from the hole on a 30 foot putt, 4 feet from the hole on a 40 foot putt and 5 or 6 feet from the hole on putts farther than 40 feet.
Putting with Loft or the “Rule of 12”
Printable Charts for the “Rule of 12” or putting with loft.
This is the Paul Runyan technique of chip using more of a putting stroke. Chipping to the closest dry position on the green that is on your intended line. Then applying the theory of “Less air time and More ground time” or chip and run.
Here is our article on “Putting with Loft.”
Reading Greens: Breaking putts and rise angle
At the outset, I’ll say that I don’t like doing math on the green. I like to play golf and do most of the math when I practice.
These charts are intended for reference and are approximate values. The actual amount of break to play or how hard you have to hit the ball uphill or downhill depends on each individual player in my mind.
They are putting resources for people who use degrees or percentage of slope in green reading.
Here is a link to our digital green reading article. It lists devices and apps that help you read slope.
Printable charts and diagrams in PDF format
Slope chart
In degrees
0.5 degree = 0.87 percent
1.0 degree = 1.75 percent
1.5 degrees = 2.62 percent
2.0 degrees = 3.5 percent
2.5 degrees = 4.37 percent
3.0 degrees = 5.24 percent
3.5 degrees = 6.12 percent
4.0 degrees = 7 percent
In percent
.5 percent = .29 degrees
1 percent = .57 degrees
1.5 percent = .86 degrees
2 percent = 1.15 degrees
2.5 percent = 1.43 degrees
3 percent = 1.72 degrees
3.5 percent = 2 degrees
4 percent = 2.29 degrees
4.5 percent = 2.58 degrees
5 percent = 2.86 degrees
5.5 percent = 3.15 degrees
6 percent = 3.43 degrees
6.5 percent = 3.72 degrees
7 percent = 4 degrees
So, measuring isn’t a bad thing in practice. However, I don’t think your league would let you whip out a digital level during play.
Rise angle: Putting uphill or downhill
This chart is in percentage increments. Degrees of slope and percent of slope are not the same…I use these for a ball park reference. Use the suggestions in the chart to practice up and downhill putts.
So, based on your game, apply 1 time, 2 times, etc. increased pace for uphill putts and the reverse for downhill putts.
| Rise Feet | Body of 6′ Golfer | Slope | ||
| run of 100′ | run of 50′ (2x) | run of 25′ (4x) | ||
| 1′ | Halfway up shin | 1% | 2% | 4% |
| 2′ | Knees | 2% | 4% | 8% |
| 3′ | Hips | 3% | 6% | 12% |
| 4′ | Bottom of Sternum | 4% | 8% | 16% |
| 5′ | Chin | 5% | 10% | 20% |
| 5.5′ | Eyes | 5.5% | 11% | 22% |
| 6′ | Top of Head | 6% | 12% | 24% |
Just for Reference
What’s fair?
It’s generally agreed a “fair” putting surface allows golfers to get even downhill approach putts within three feet of the hole and keeps break for short second putts “within the hole” to reward good shots. More importantly, flat areas around the hole location reduce time consuming green reads and three putts, thus keeping challenge reasonable for everyday play and reducing slow play.
| As Per Lemons ASGCA | |||
|---|---|---|---|
| Recommended Stimp Meter | Marginal Max. Max. Downhill % | Stimp Meter | Max Downhill % |
| 14 | 2.90% | 14 | 3.85% |
| 13 | 2.99% | 13 | 4.20% |
| 12 | 3.24% | 12 | 4.55% |
| 11 | 3.58% | 11 | 4.90% |
| 10 | 3.90% | 10 | 5.42% |
| 9 | 4.35% | 9 | 5.95% |
| 8 | 5.86% | 8 | 6.65% |
| Chart A |
Pro Green Slope
“All my practice is built around those greens books,” says Phil Mickelson. “In my yard I have a green with 1-, 2-, 3- and 4-degree slopes. I practice on that so I can equate it to the greens book when I play.” At the U.S. Open, players were able to consult their green-reading materials.
These yardage books are a good example of pro green slope in degrees.