Using a Shot Scope V3 is a great way to track your putting stats. It’s a GPS Watch with Automatic Performance Tracking. View you shots, score, stats and strokes gained on your phone, tablet or computer.
I bought the GPS watch and performance tracker mostly to have yardage info in a handy way.
What I didn’t realize is that I also received a lot of feed back from Shot Scope based on their database of player stats.
Their CEO reported in July 2022 that the Shot Scope database has over 100,000 golfers from 162 different countries, and they have recorded over 180 million shots to date.
What’s even better is there are free updates and no annual fees. Shot Scope
Benchmarking Your Stats
I use Shot Scope because it gives me a visual record of what I’m doing well and and what I’m not doing well at.
It tracks your whole game, However, putting stats and short game stats are where most people can improve. Especially the older you get.
I look at the stats and ask myself, “Where are you losing strokes?”
You can set the date range to view stats and you can compare yourself to Tour Players all the way to those with a Plus 25 handicap. Options are Tour Player, 0, 5,10, 15, 20 and 25 handicap for “Strokes Gained”.
I set it for my handicap to see how I’m doing against similar players.
Here is a photo of the options for performance stats.
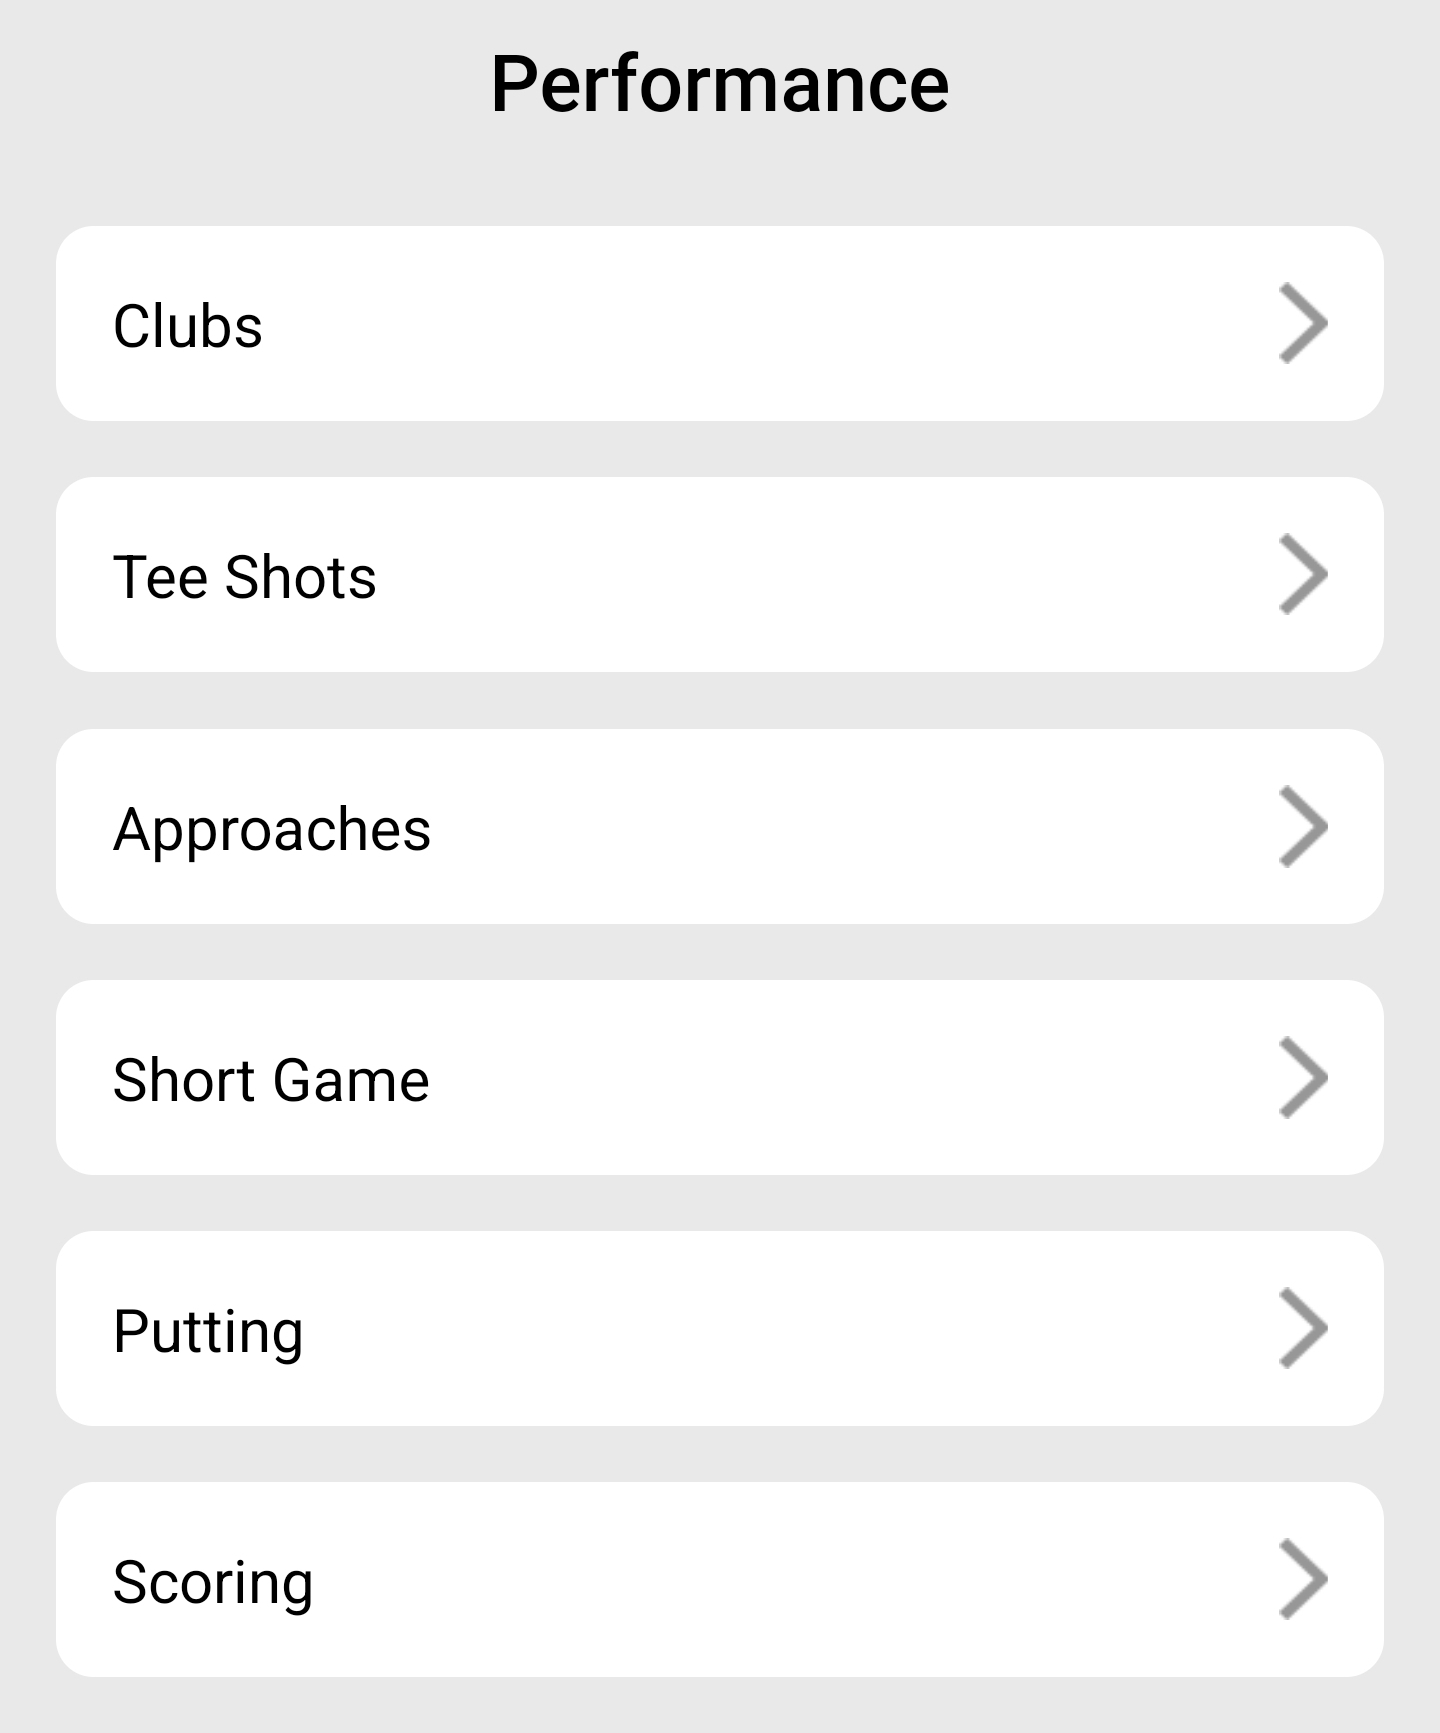
Putting Stats – Make Percentage
They added the “Strokes Gained” option some time ago. You can toggle it on or off.
I toggle it off most of the time as there is a lot of data on the screen already.
Personally, I like to track my putting make percentages and the number of 1, 2 and 3 putts.
These are two putting stats I watch every time I go out. The photos are below.
Note: Putting make percentages are 0-3 feet, 3-6 feet, 6-9 feet, 9-12 feet, 12-18 feet, 18-24 feet, 24-30 feet and 30+ feet.
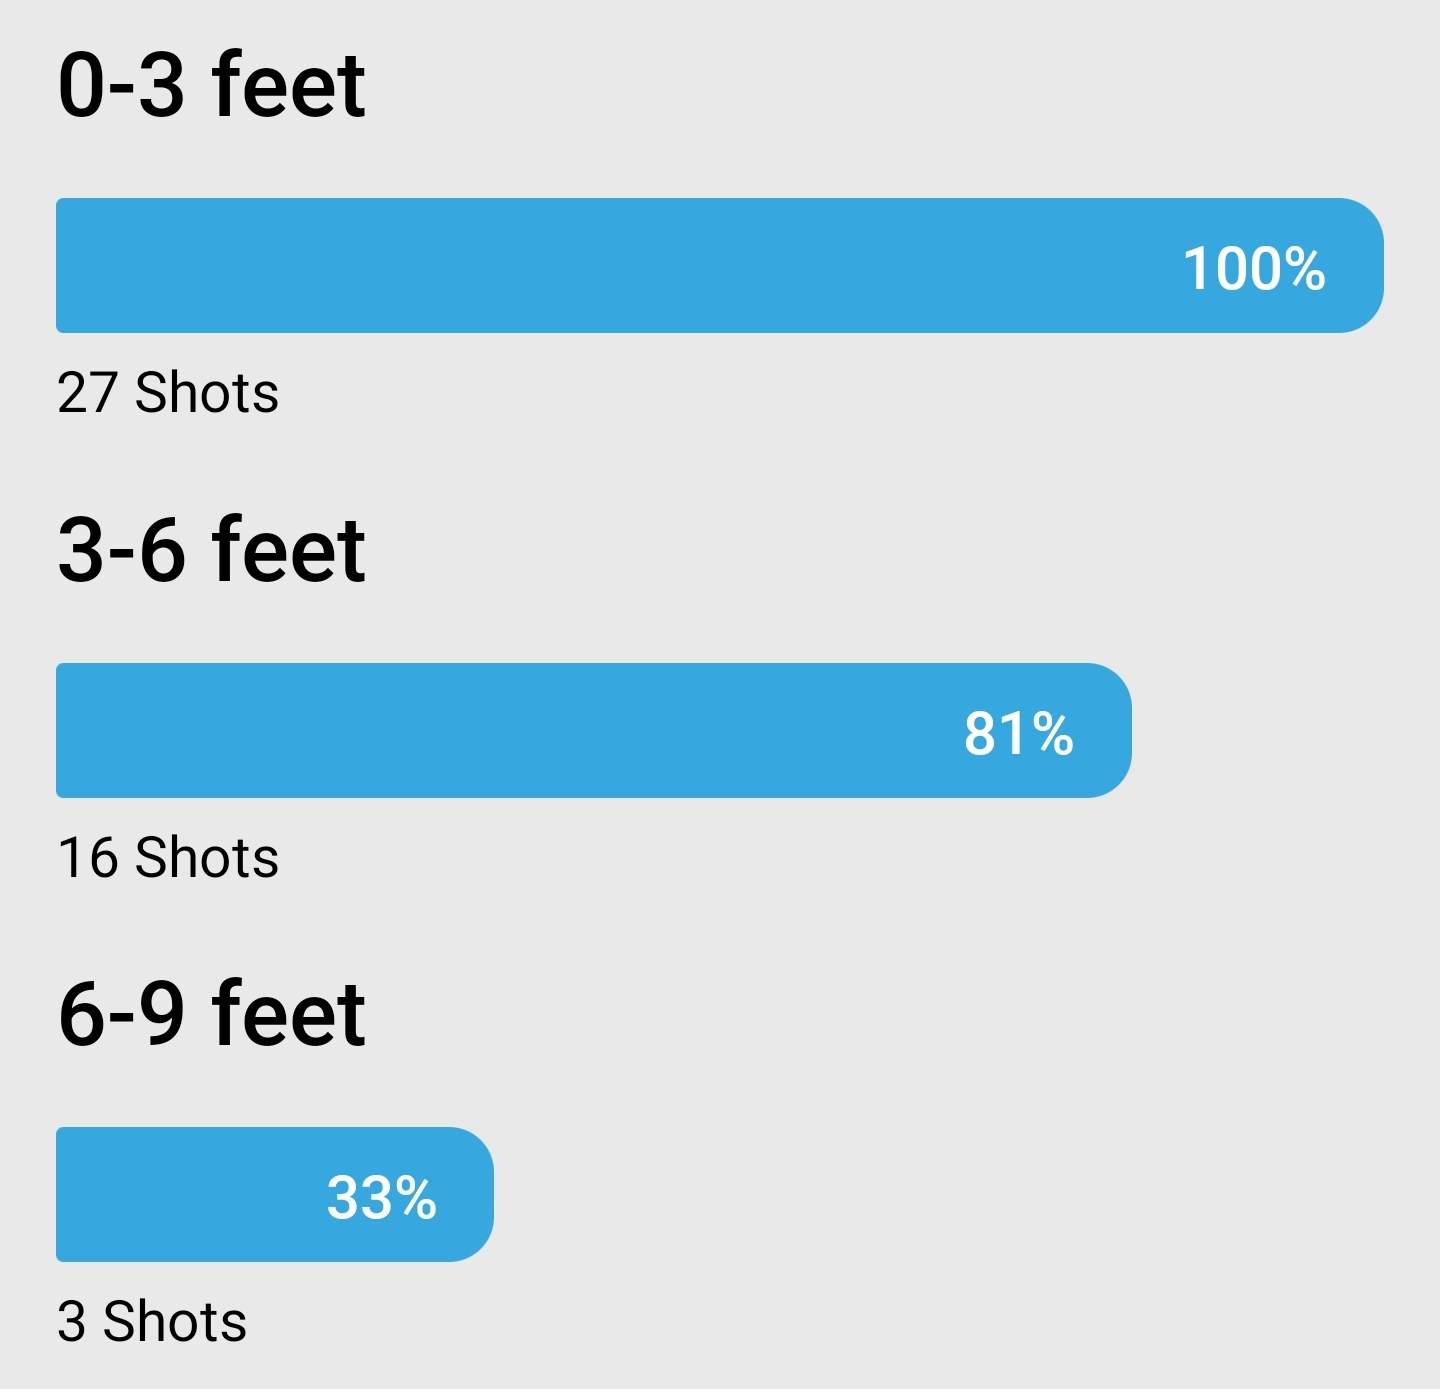
Still need to work on 10 feet and under.
Only some of the make percentages
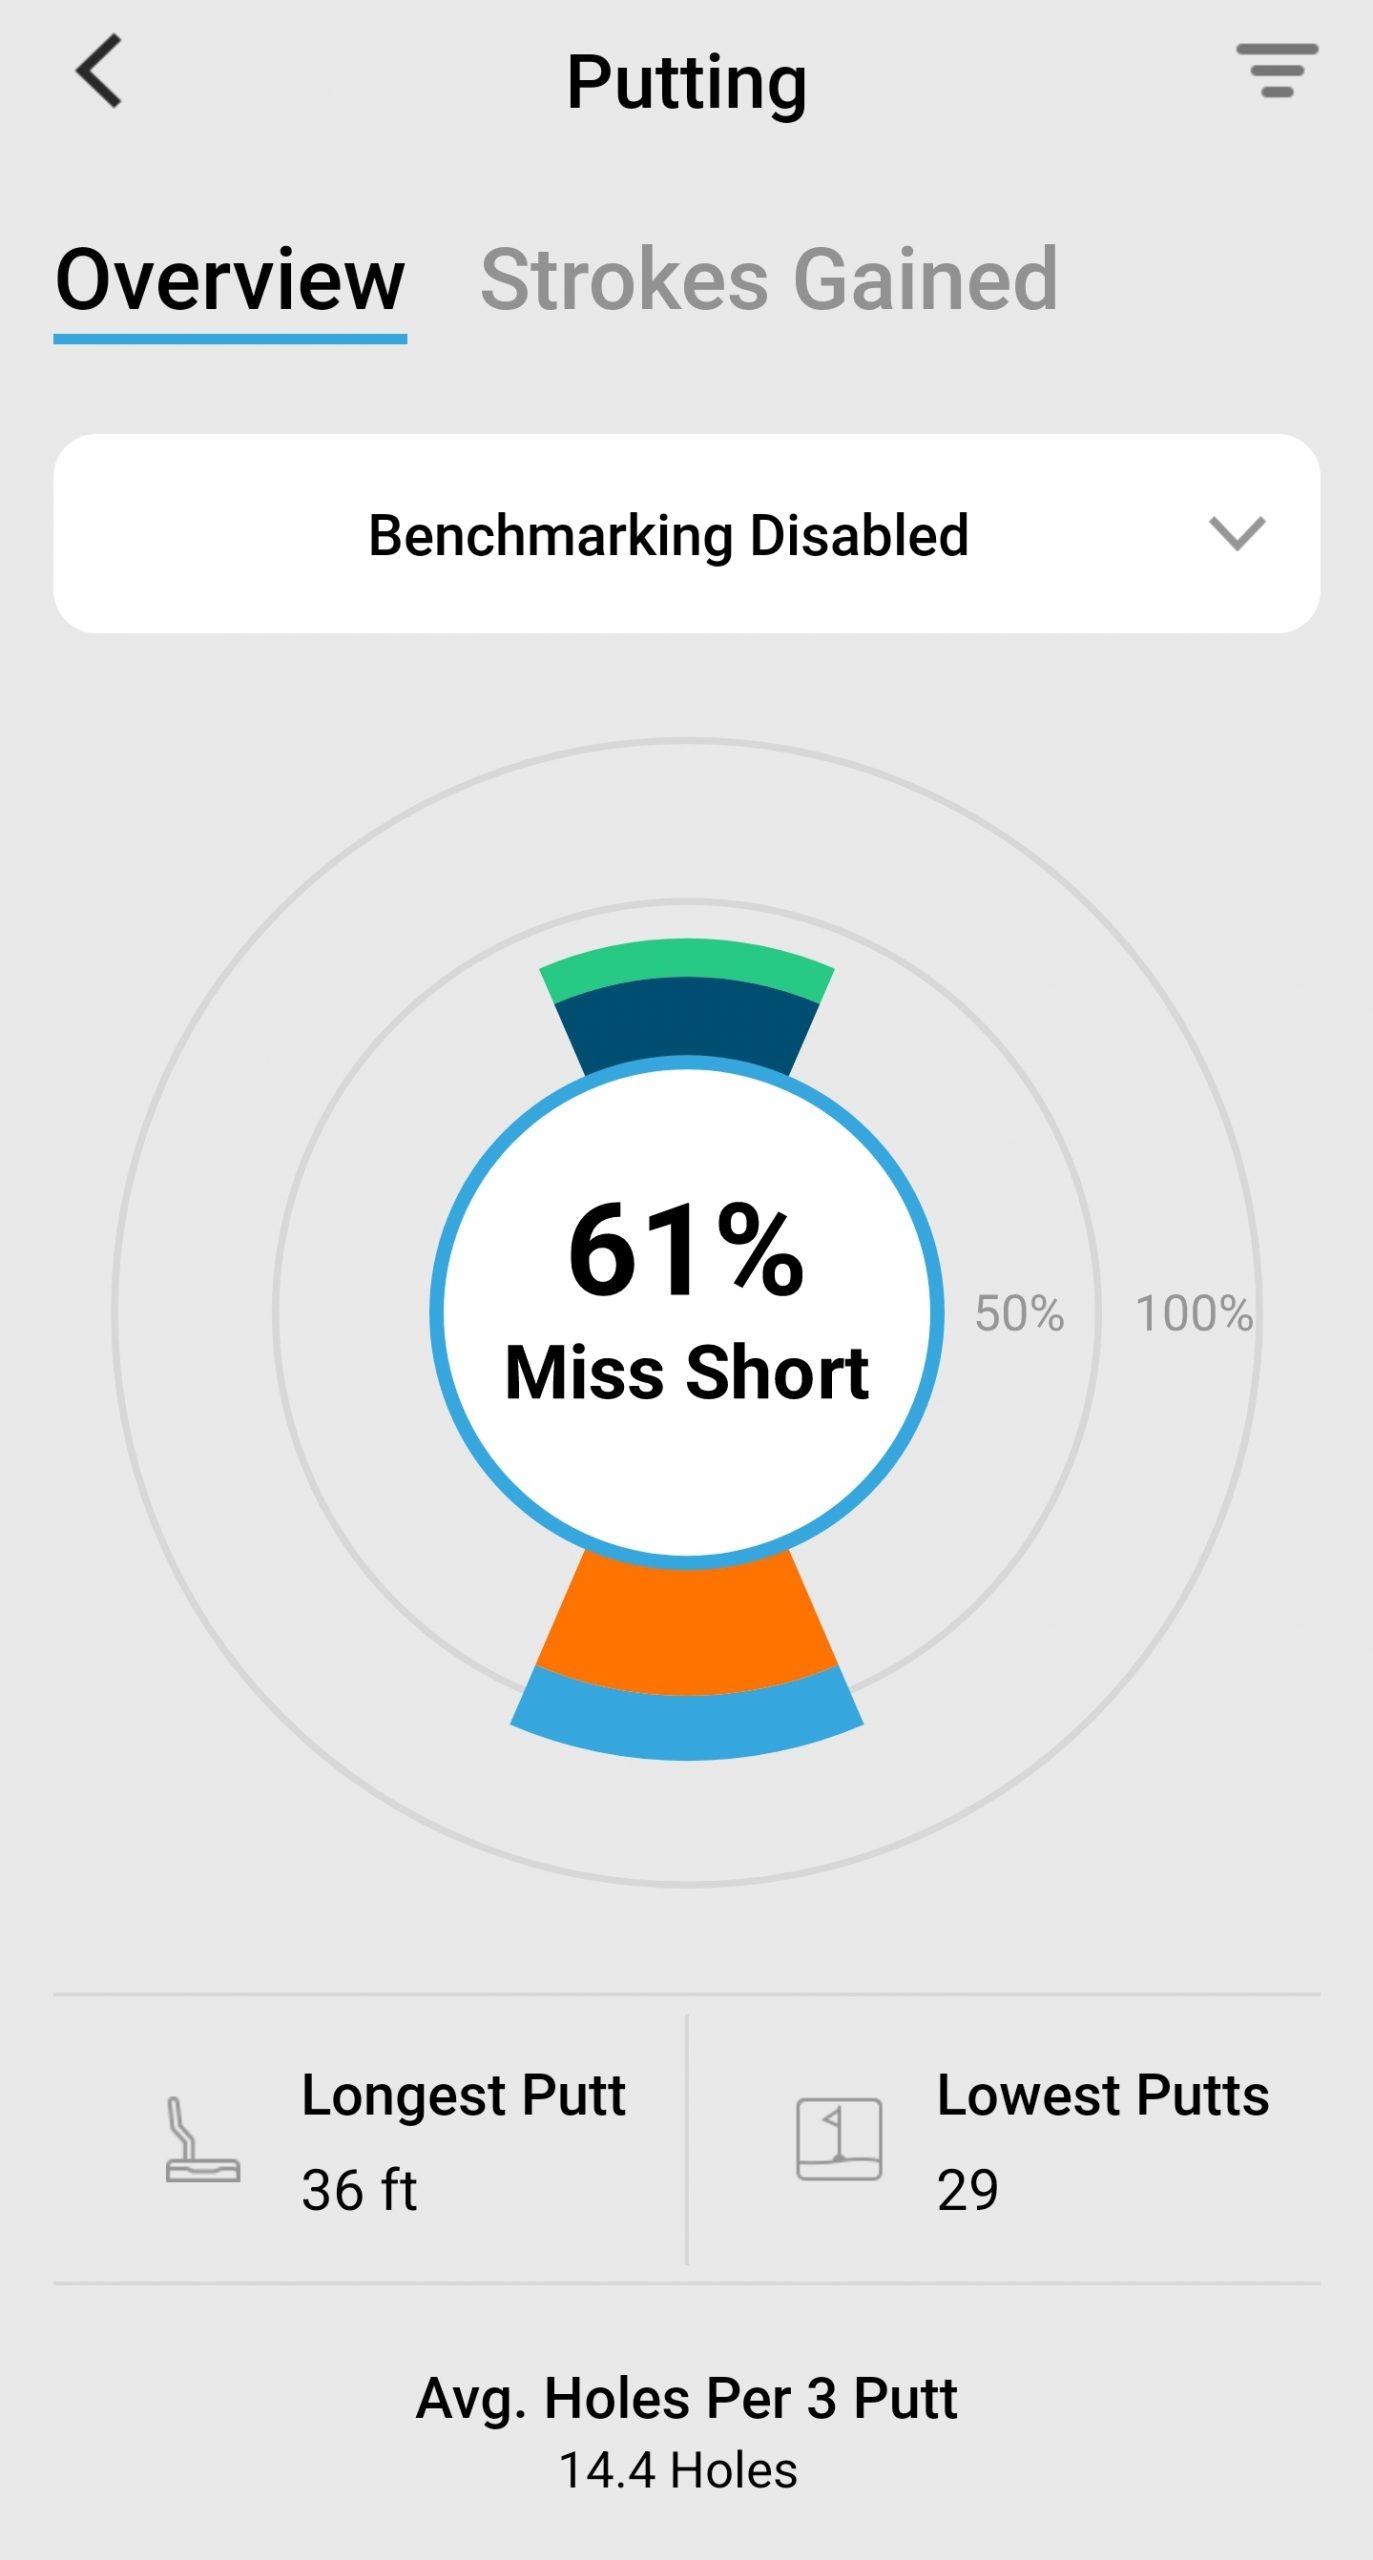
Putting Stats – Short or Long
This next photo is more of a chart. You can click on the different portions to view long or short putts. The inside rings (blue and orange) indicate the percentage you were long or short by less than 1 meter or a little over a 3 feet.
I had to choose the last 15 rounds to get the low number of putts to show up. I mention that because there is a fairly large amount of putts left short.
My last 5 rounds I left 50 percent of my putts short. To me this is not a awful.
Why? The course I play at has pretty tough greens. You could easily 3 putt every green. So short isn’t always a bad thing if you are lag putting.
I was able to start missing on the high side long for 50 percent of my misses at the end of the season.
So what else does this next photo indicate?
Over the last 15 rounds my longest putt was 36 ft. As I said I was leaving 61 percent of my putts short. The flip side of that is I was only 3 putting once in 14.4 holes on average. My lowest number of putts for 18 holes was 29.
If enabled, it adds Strokes Gained
Putting Stats – Strokes Gained
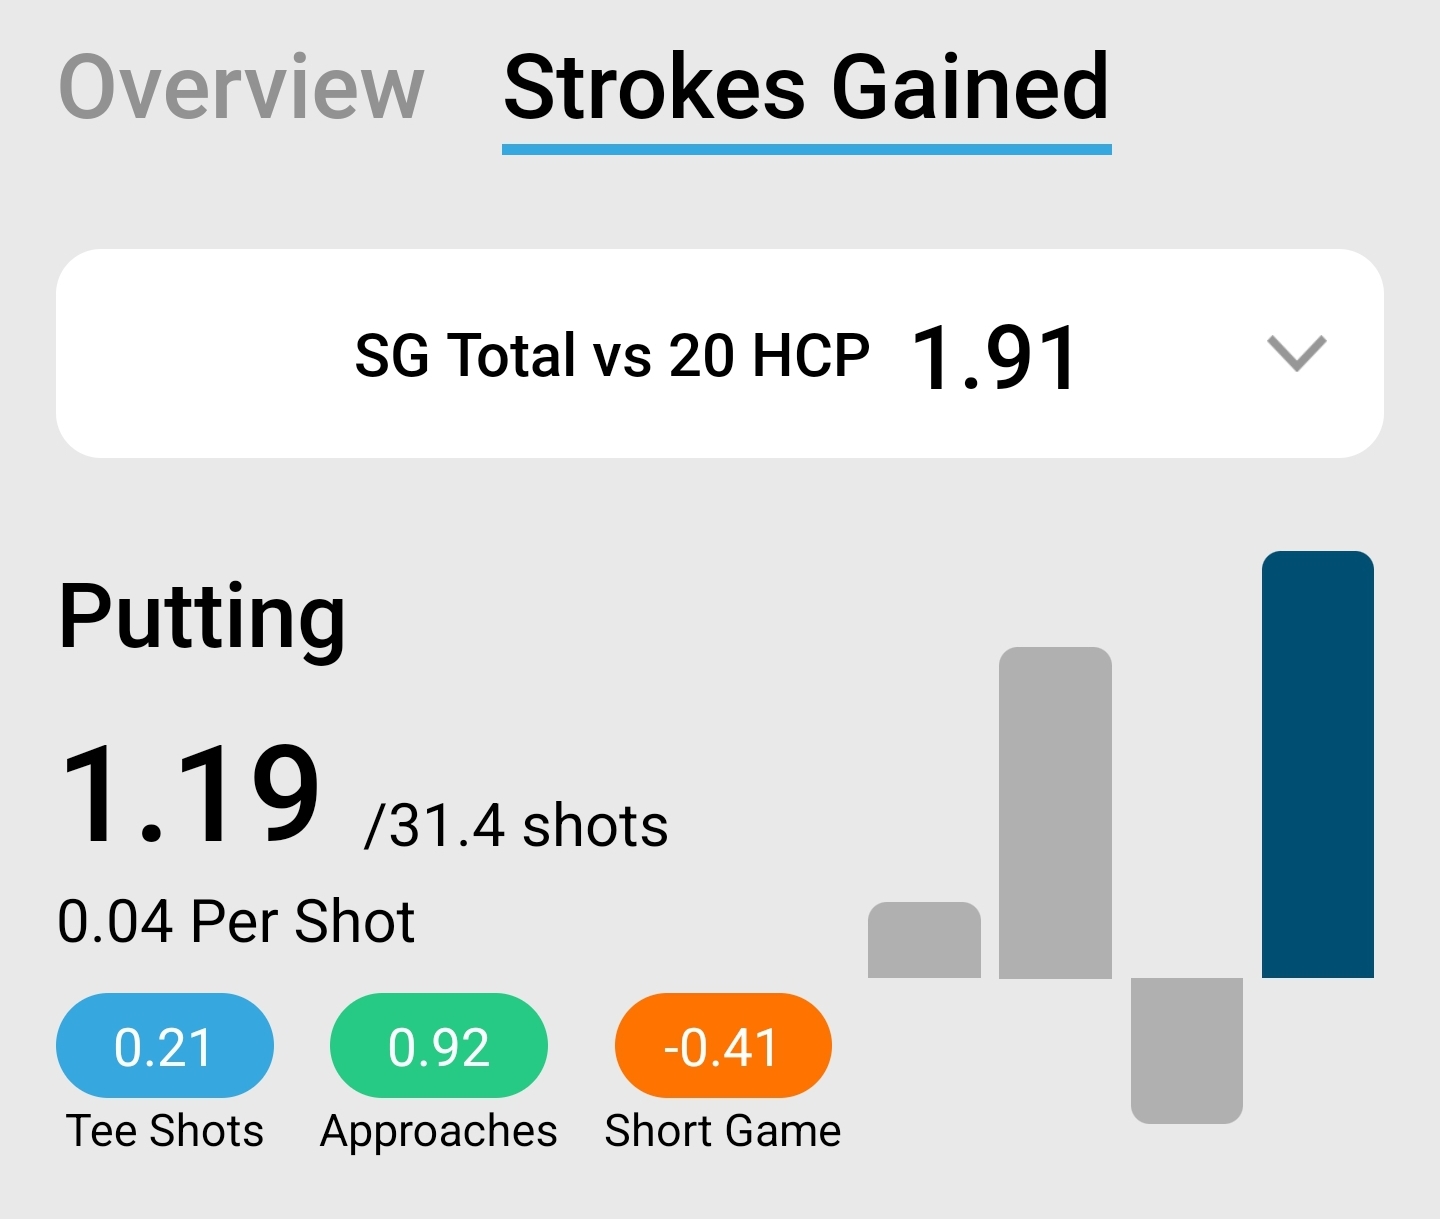
One other stat I like to keep and eye on is strokes gained. While I’m about a 20 handicap golfer, my putting is better.
The photo below indicates that I need to work on my short game. I did that this year and was pretty successful for the last 5 rounds.
So what this is saying is that based on 15 rounds, I would gain1.19 shots “putting” for every 31.4 shots versus another 20 handicapper. Total strokes gained versus a 20 handicap is 1.91.
Plus numbers are good and negative numbers are not good.
I’m not on Tour…this isn’t bad. However, if I change the handicap to 15 I’m losing strokes to that handicap.
Conclusion
I think this is a handy tool. I would highly recommend the Shot Scope V3 or one of their other new products.
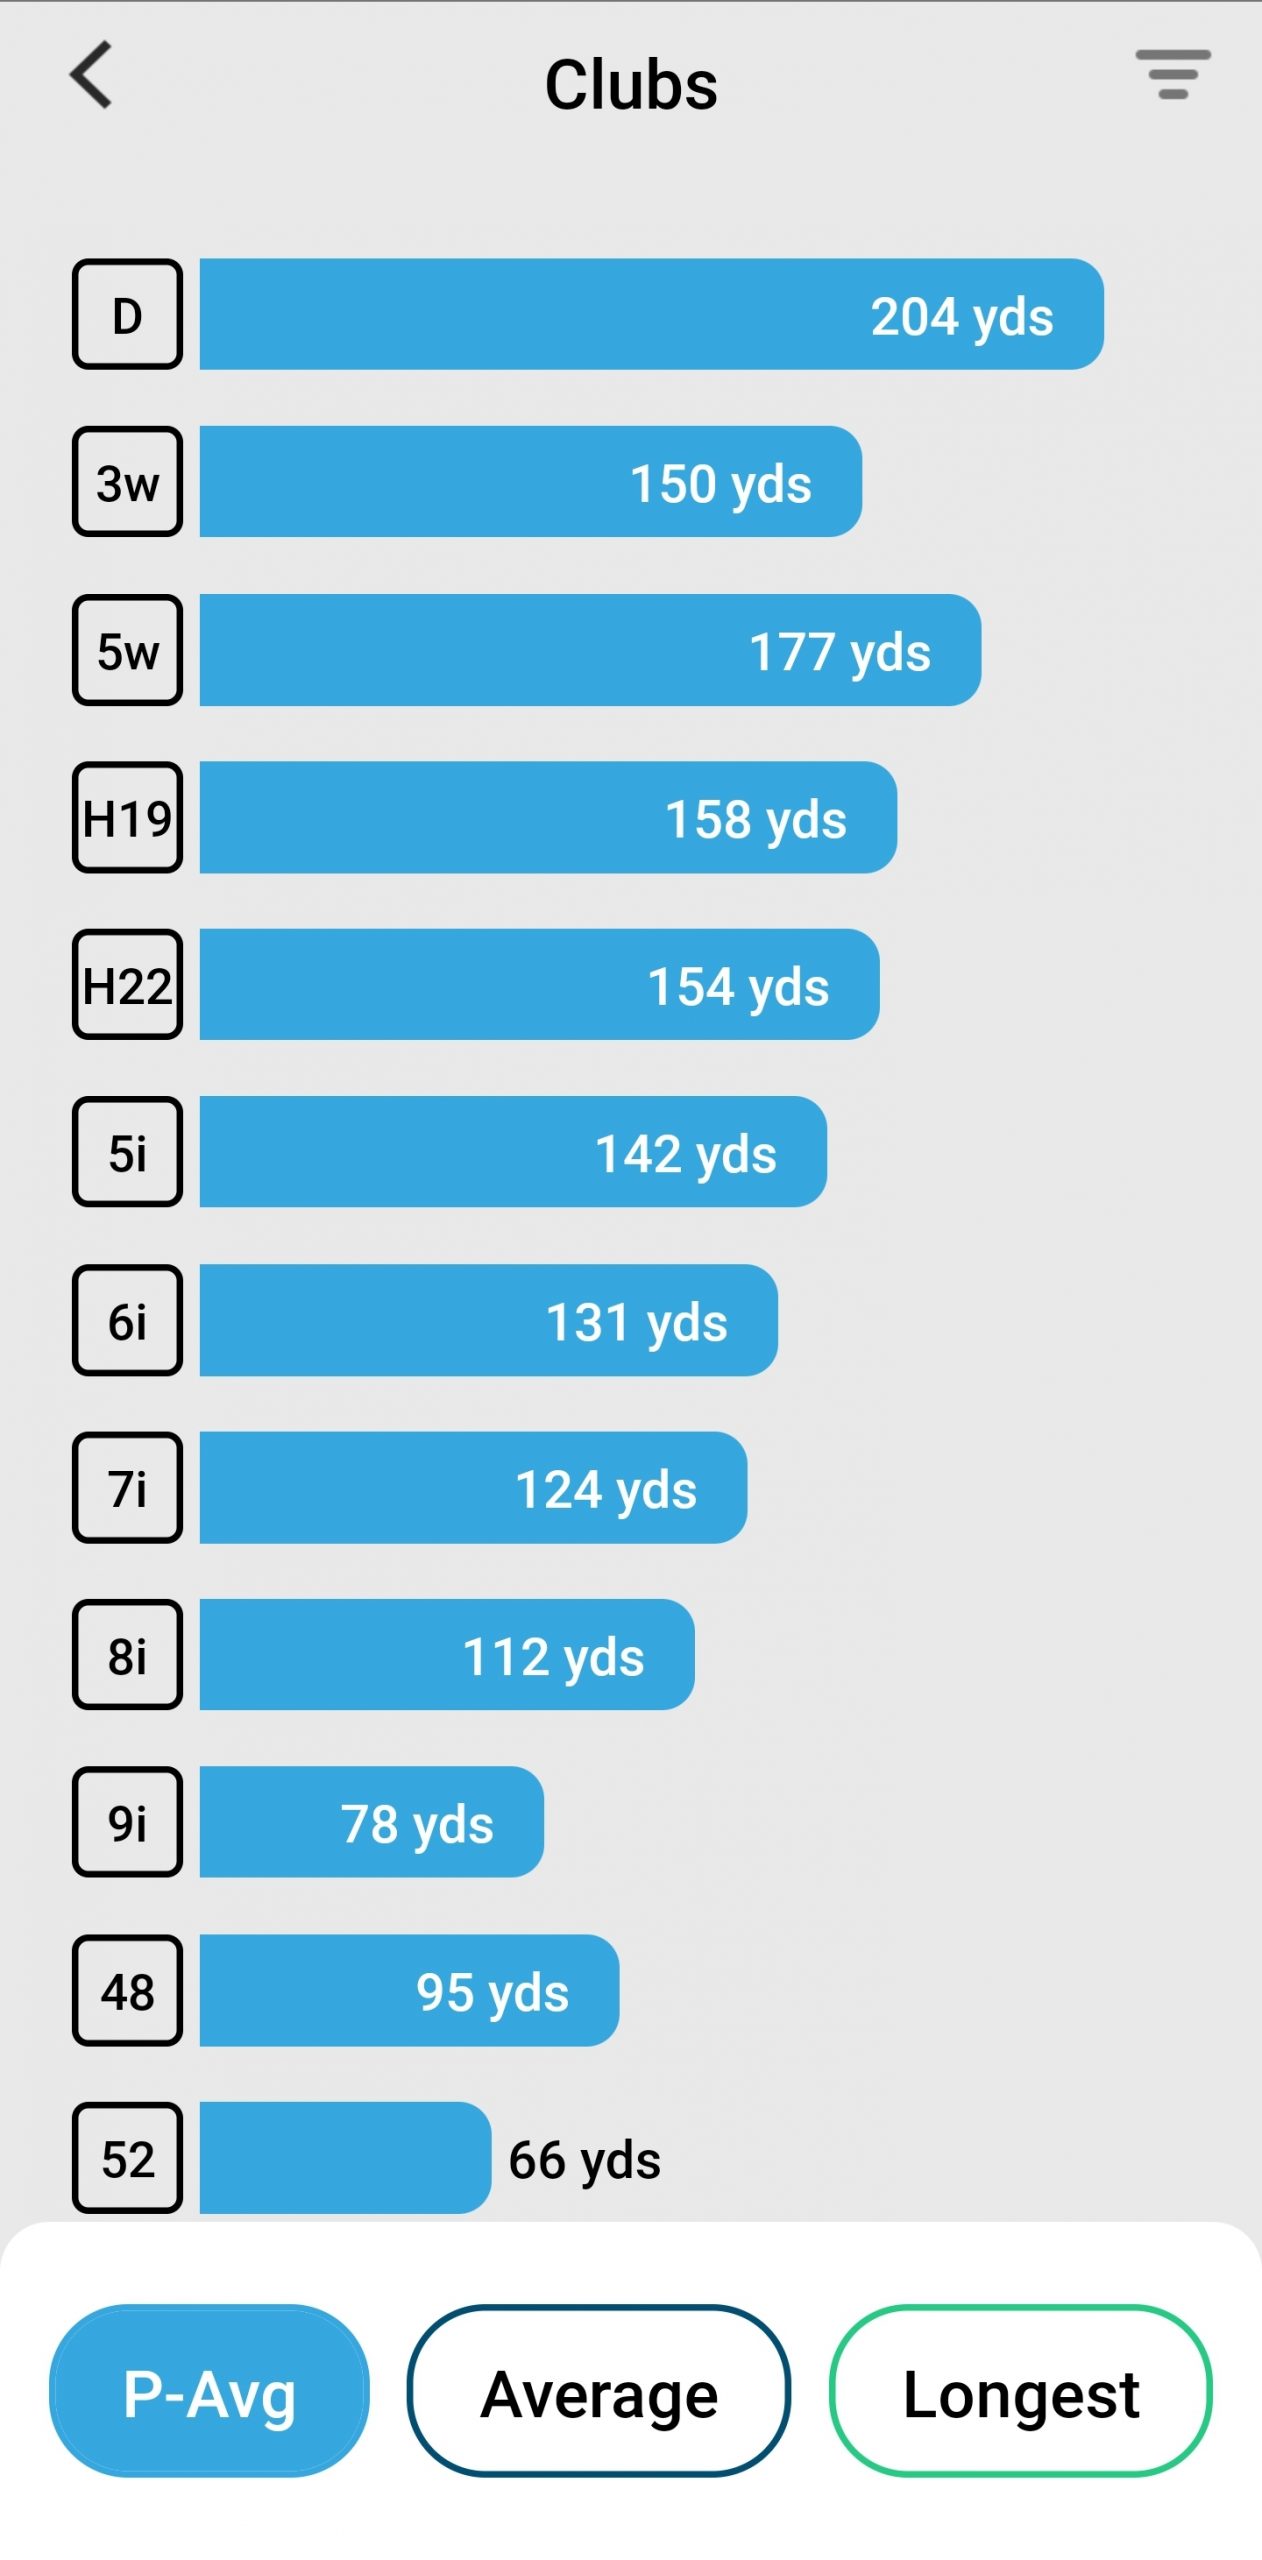
Another really good feature is under “CLUBS.” The system keeps track of your Performance Average, Average and Longest shots with each club.
Why performance average? If you chip with a 7 or 8 iron it is not really an approach shot or tee shot. They figured out a way to make your Performance Average more accurate.
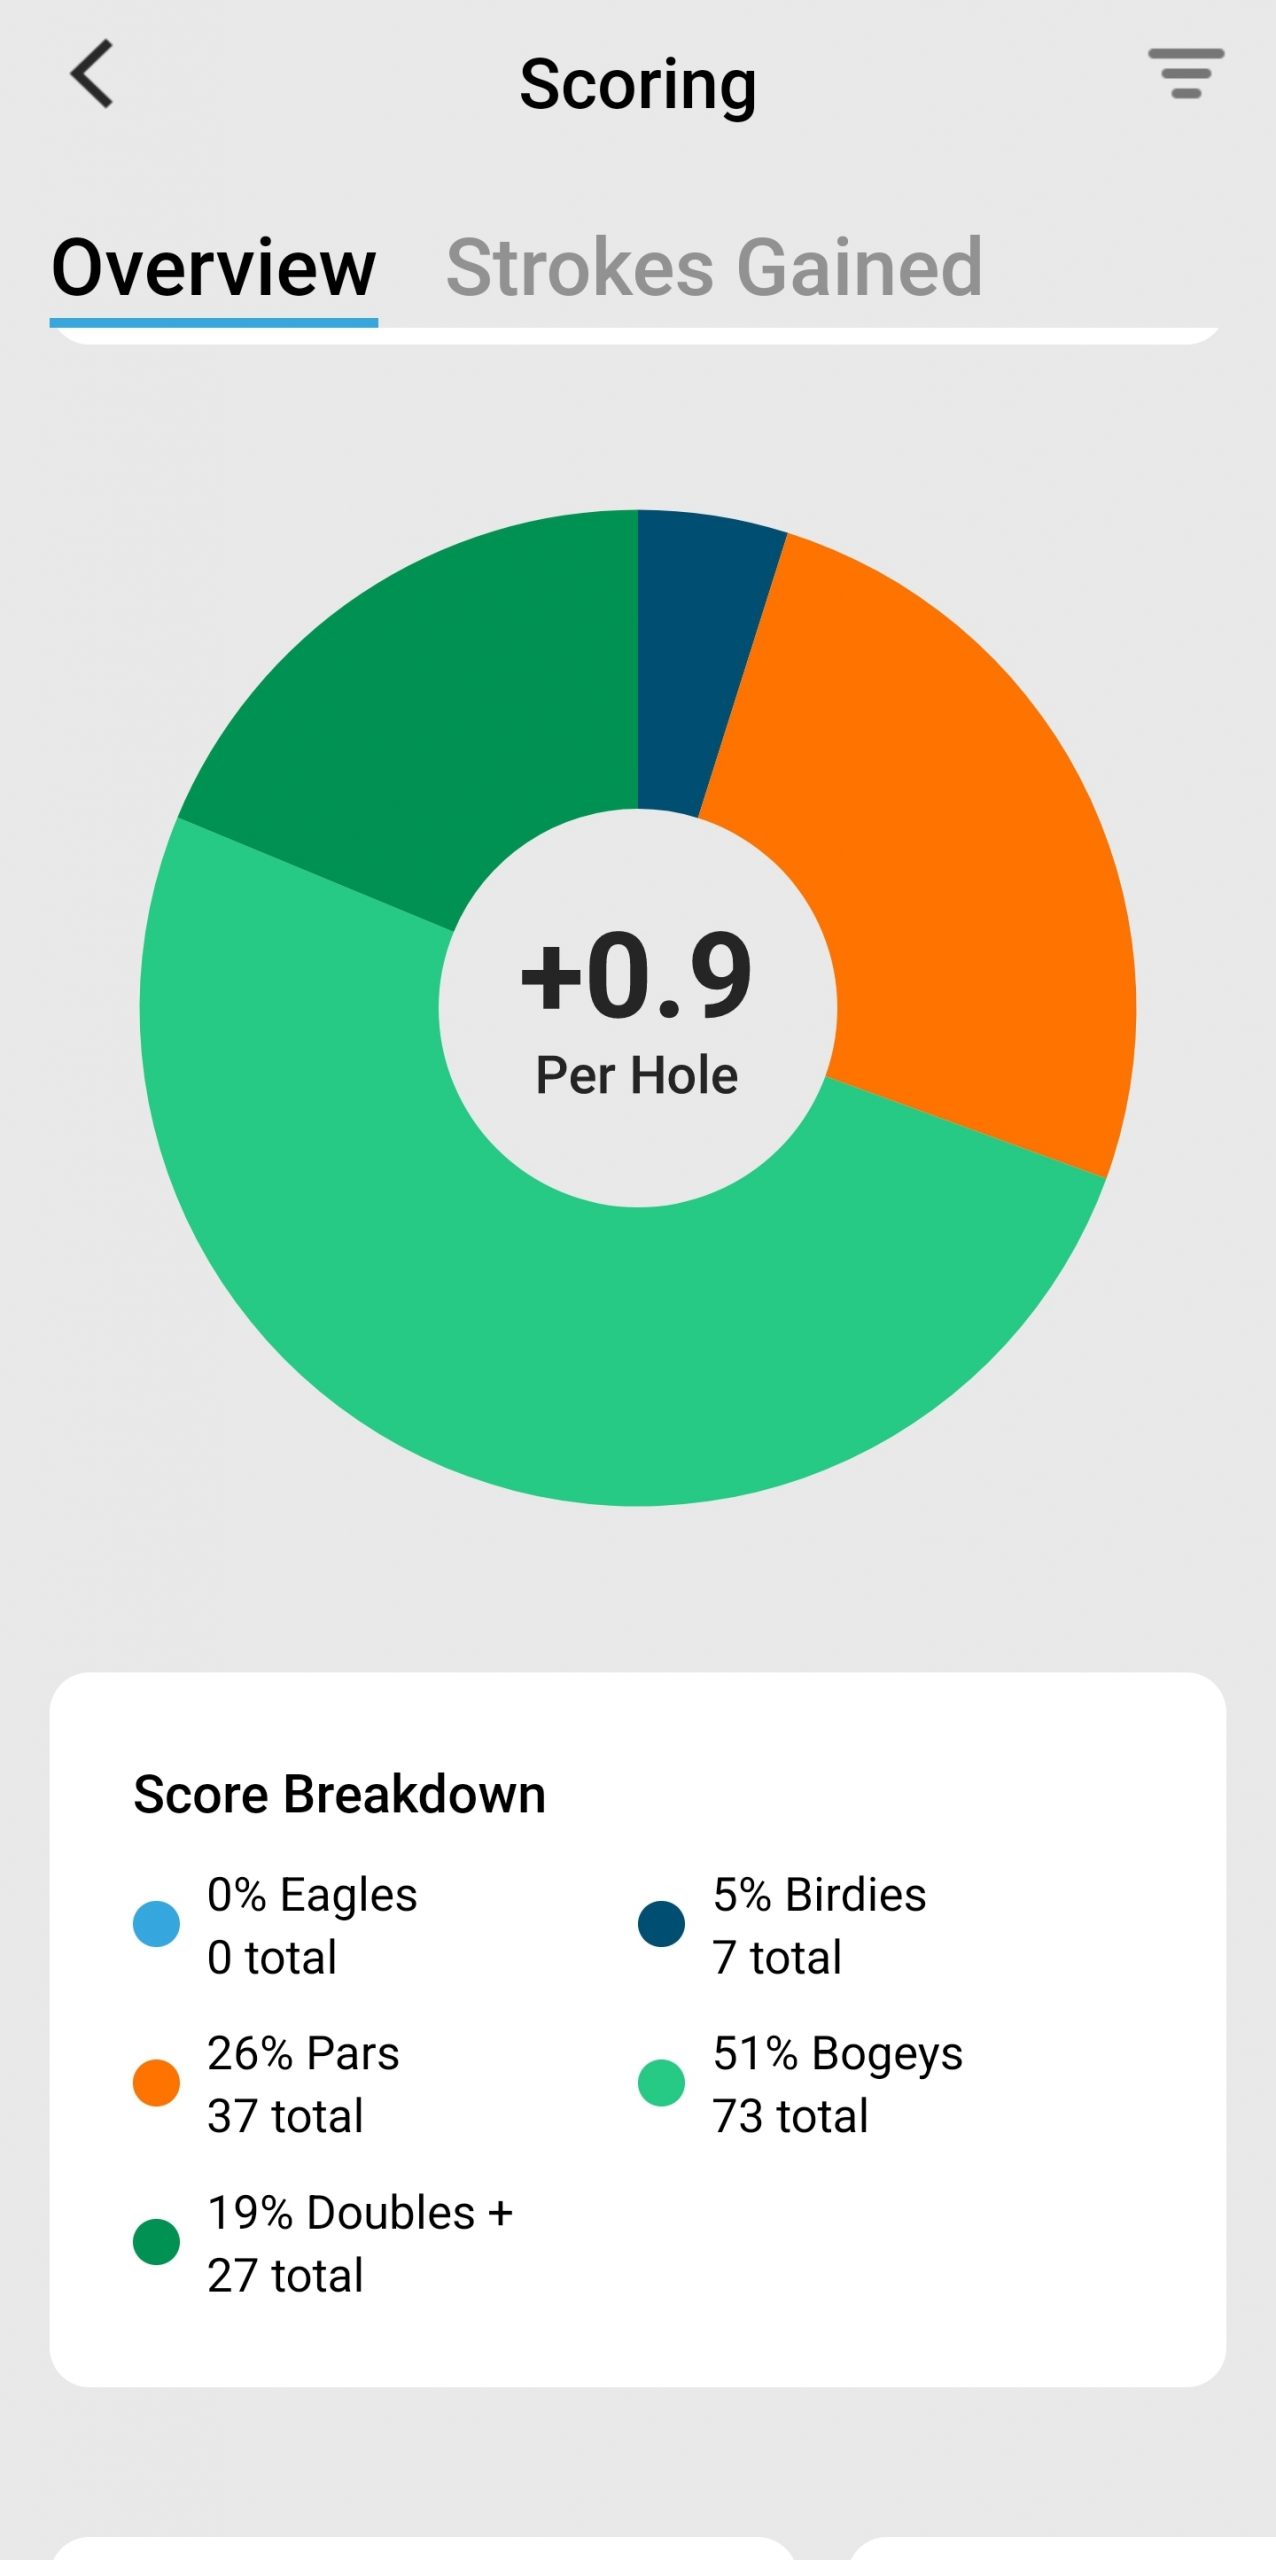
The image below is one that really tells a story and it’s really the bottom line for me.
My thoughts are that I make way too many double bogeys and not enough pars. The answer is in the details as I’ve mentioned above.
I can tell you that the vast majority of the double bogeys came from hitting my ball into some trouble. There are some legit 3 putts which really is uncalled for, but it happens.
More Photos
Here are a few more. There is too much data to include photos of everything they provide.
Just a note on the clubs tab. I have to play the old guy tees now.
It’ a pretty fair example of being able to know your distances with each club. It would be much more accurate if I played more often. It’s about 8 to 10 yards per club.
Every club gets it own screw in tag. It keeps track of distance as you change clubs and strike the ball again
I couldn’t get them on the page
These are tee shots from a normal 18 hole course.
Here is why there aren’t many tee shots in the image.
I play at a Championship Par 3 course. So all the tee shots there are considered approach shots by Shot Scope. Good to know.
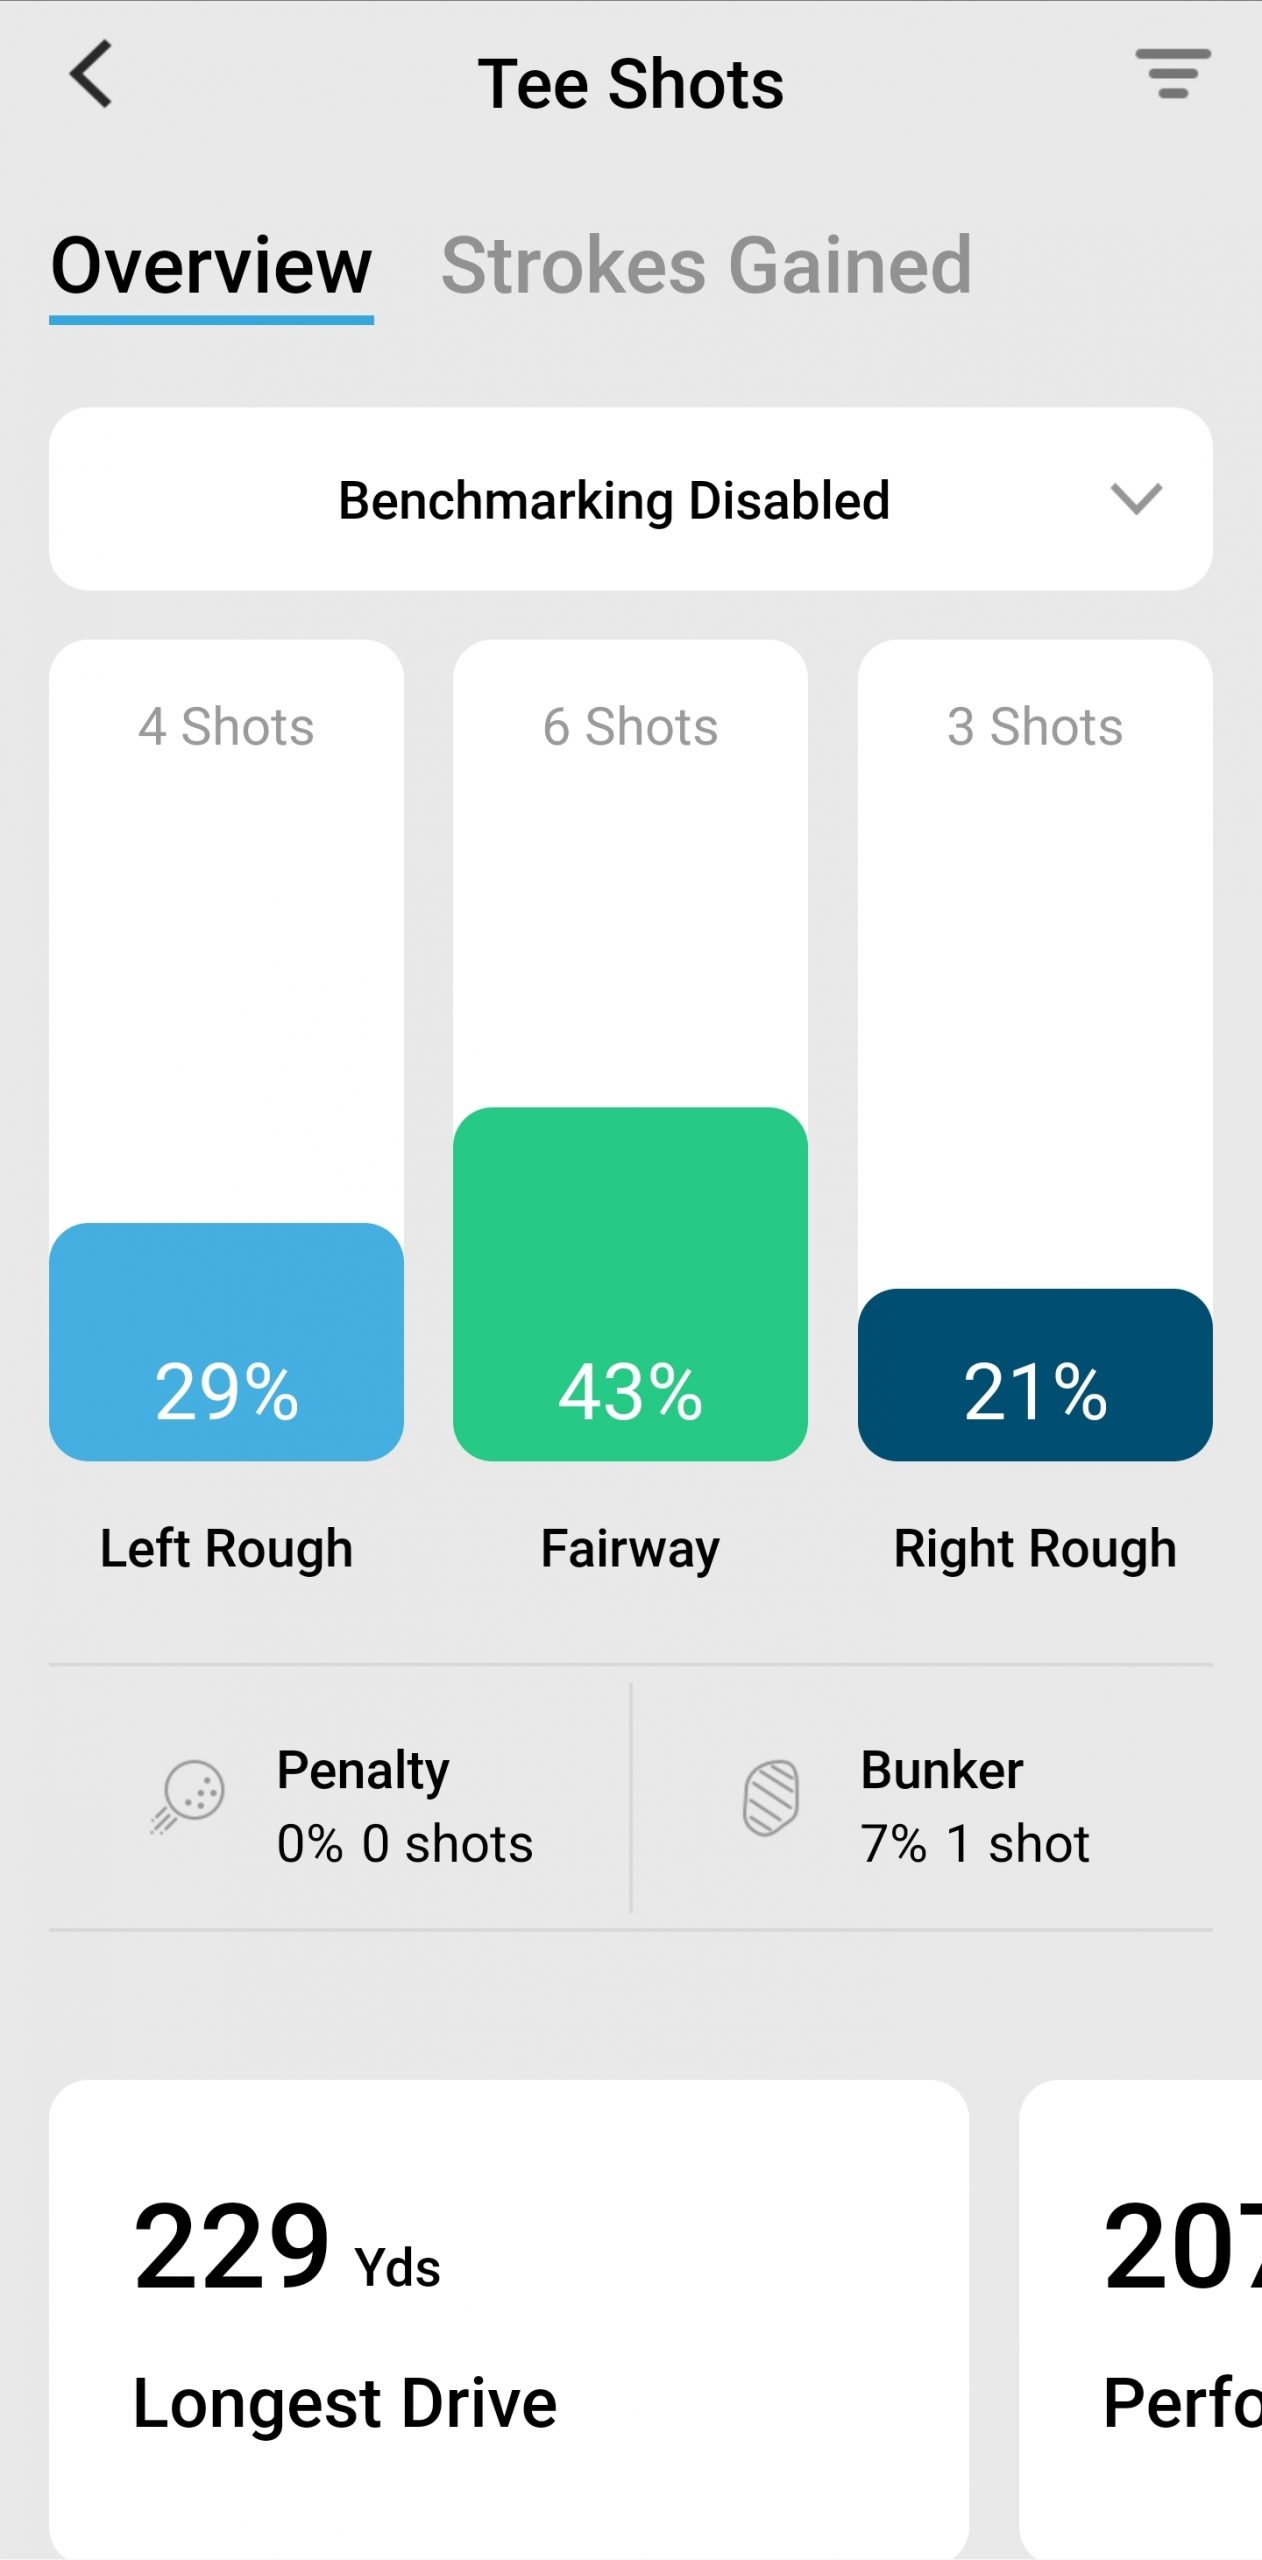
Tee shots are Par 4 & 5 holes only
From Shot Scope:
Approach shot: Any shot that is taken from outwith of 50 yards to the pin and is not the tee shot. Par 3 tee shots are also considered approach shots in your stats.
Short Game shots: Any shot from inside 50 yards to the pin that is taken from off the green.
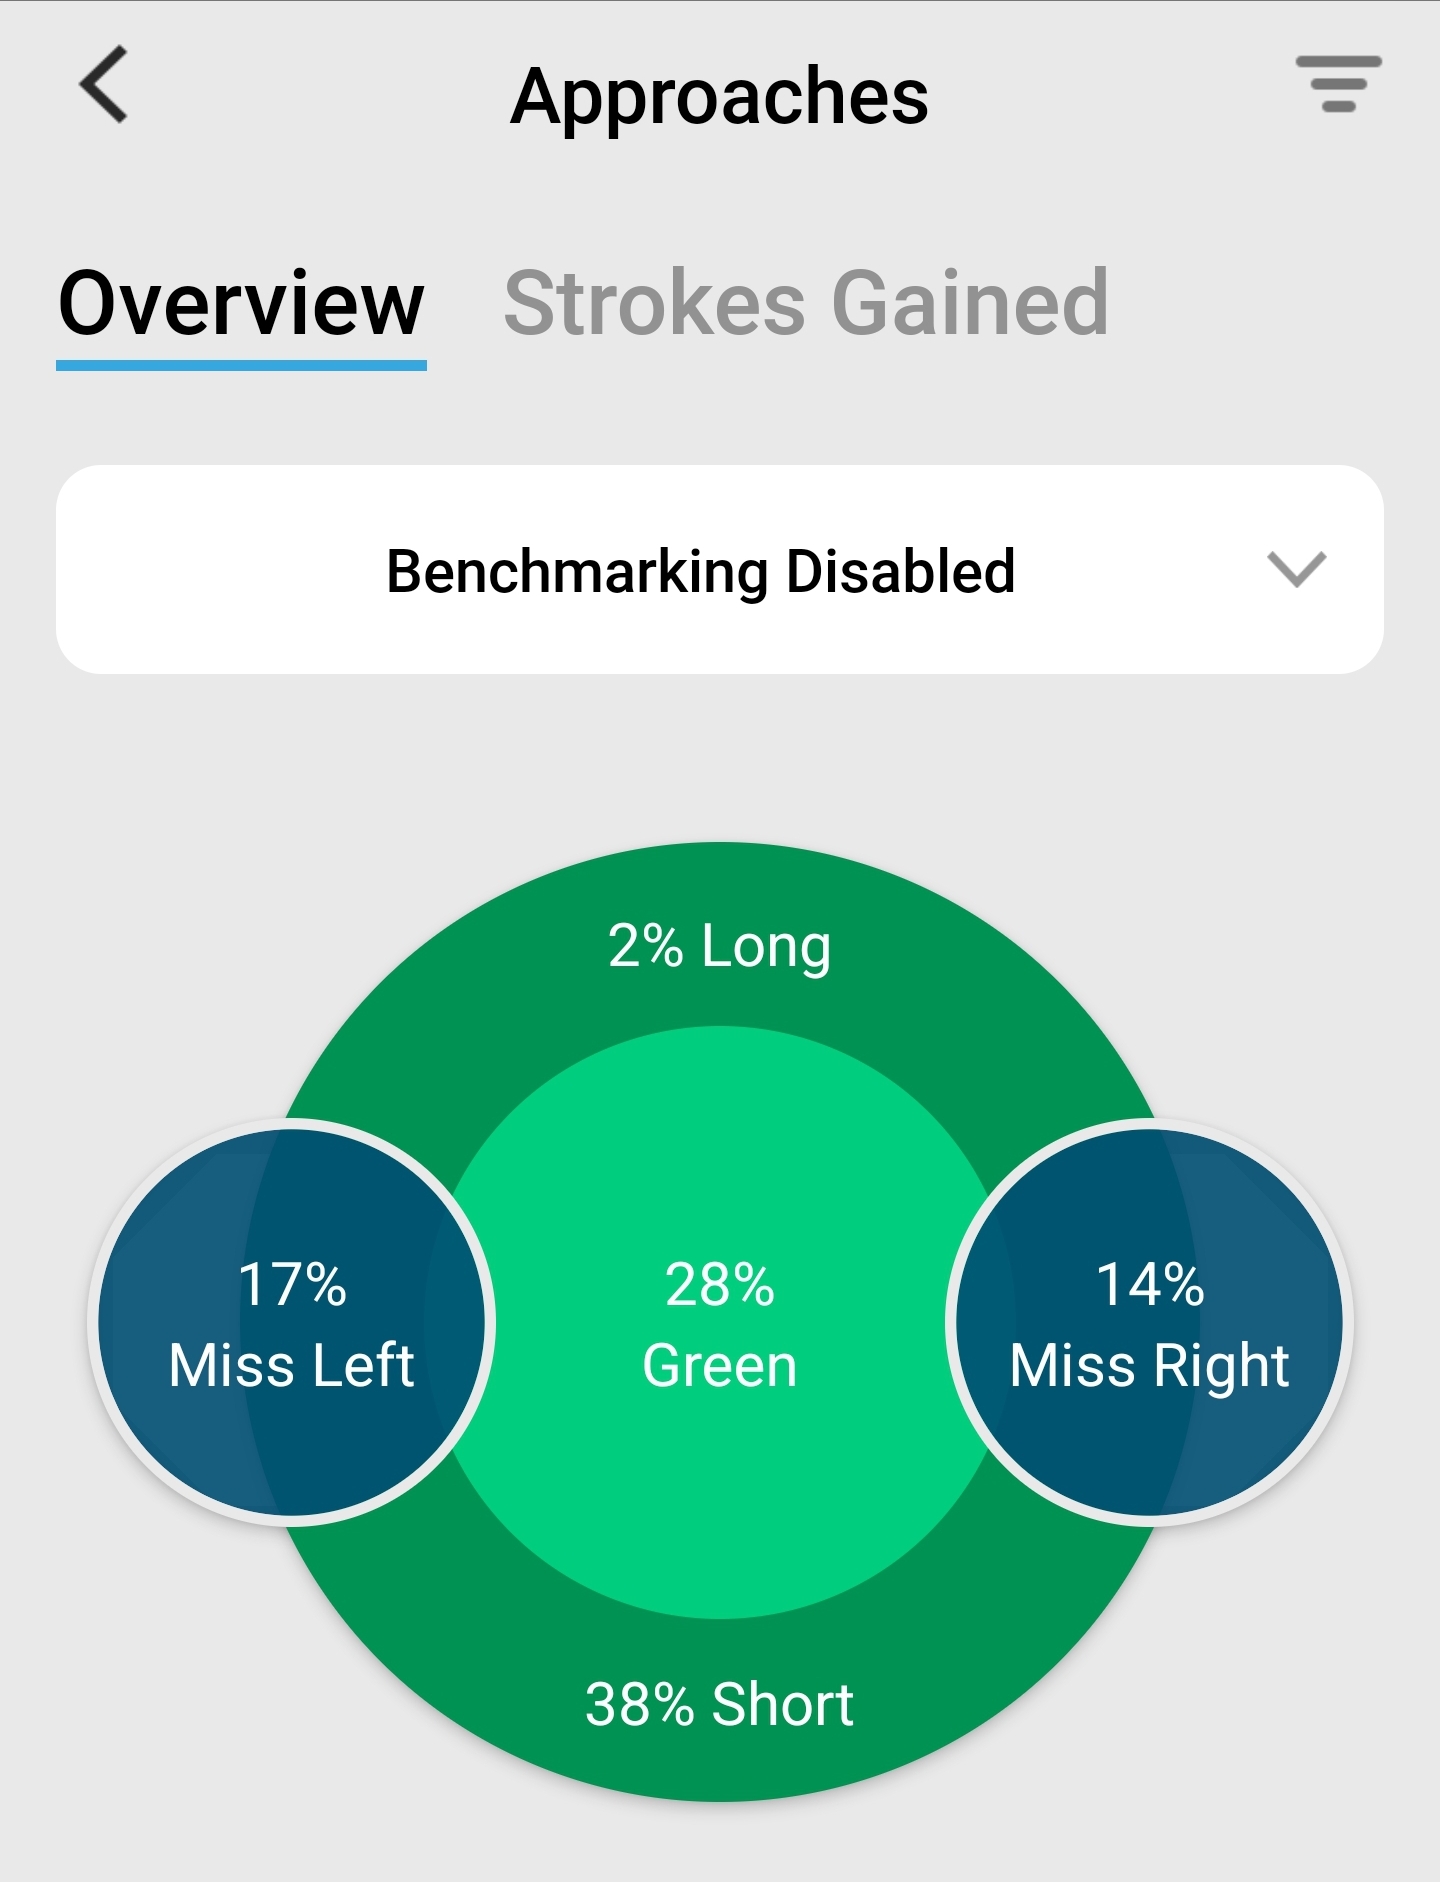
I need to play more.
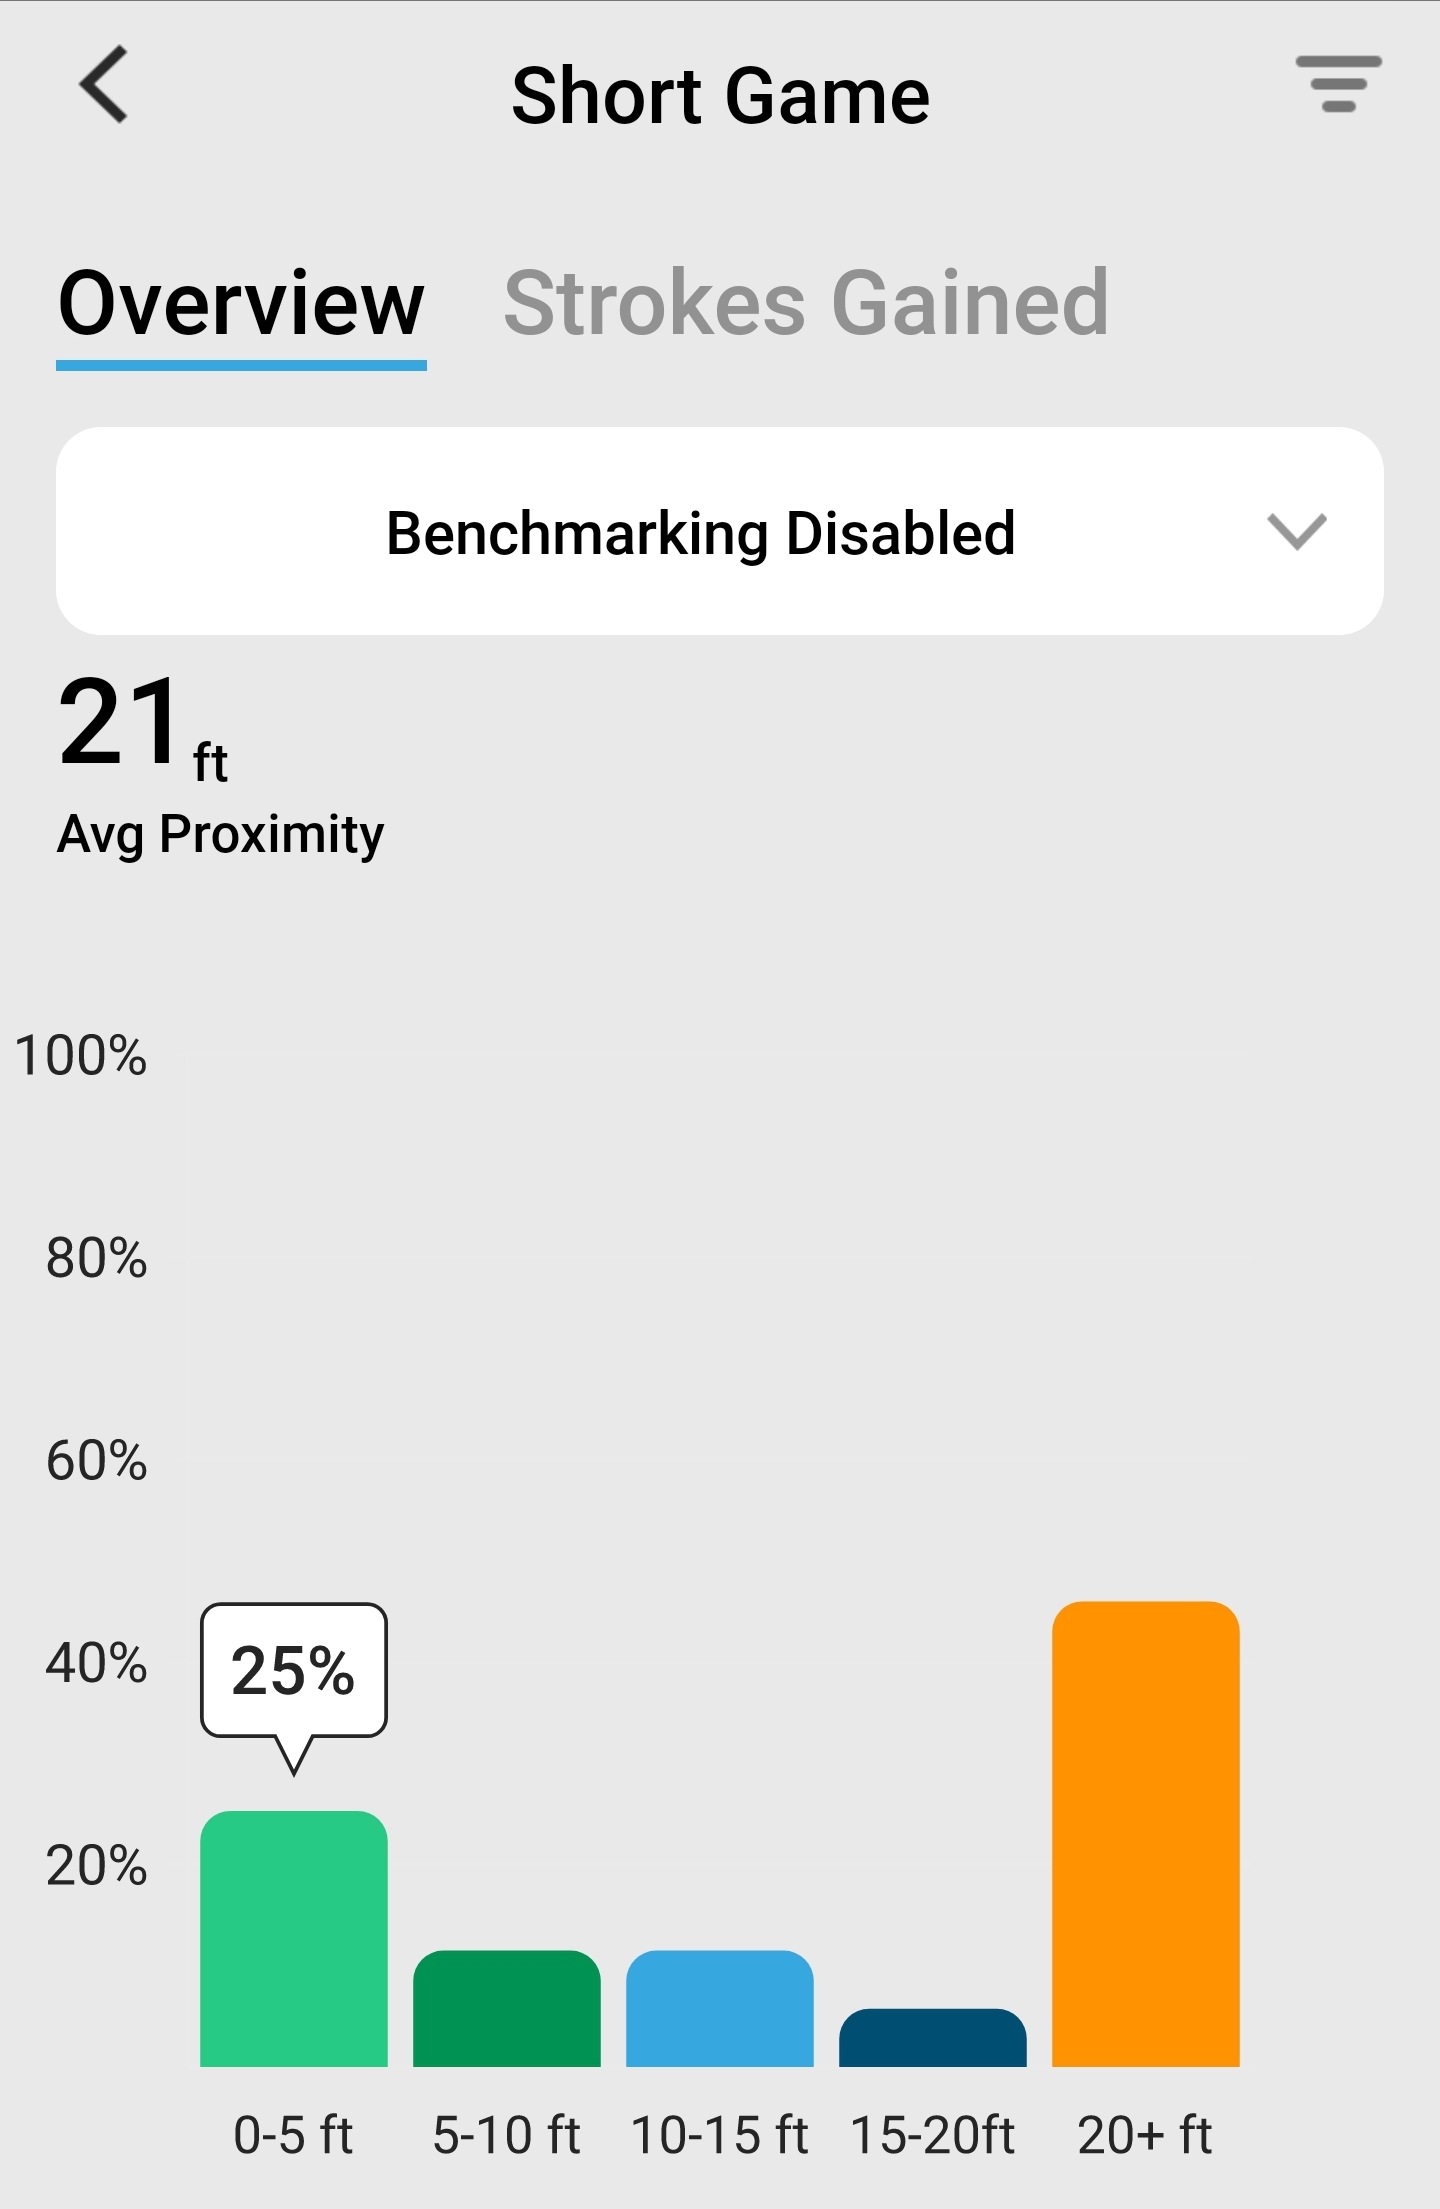
25 percent is not good.
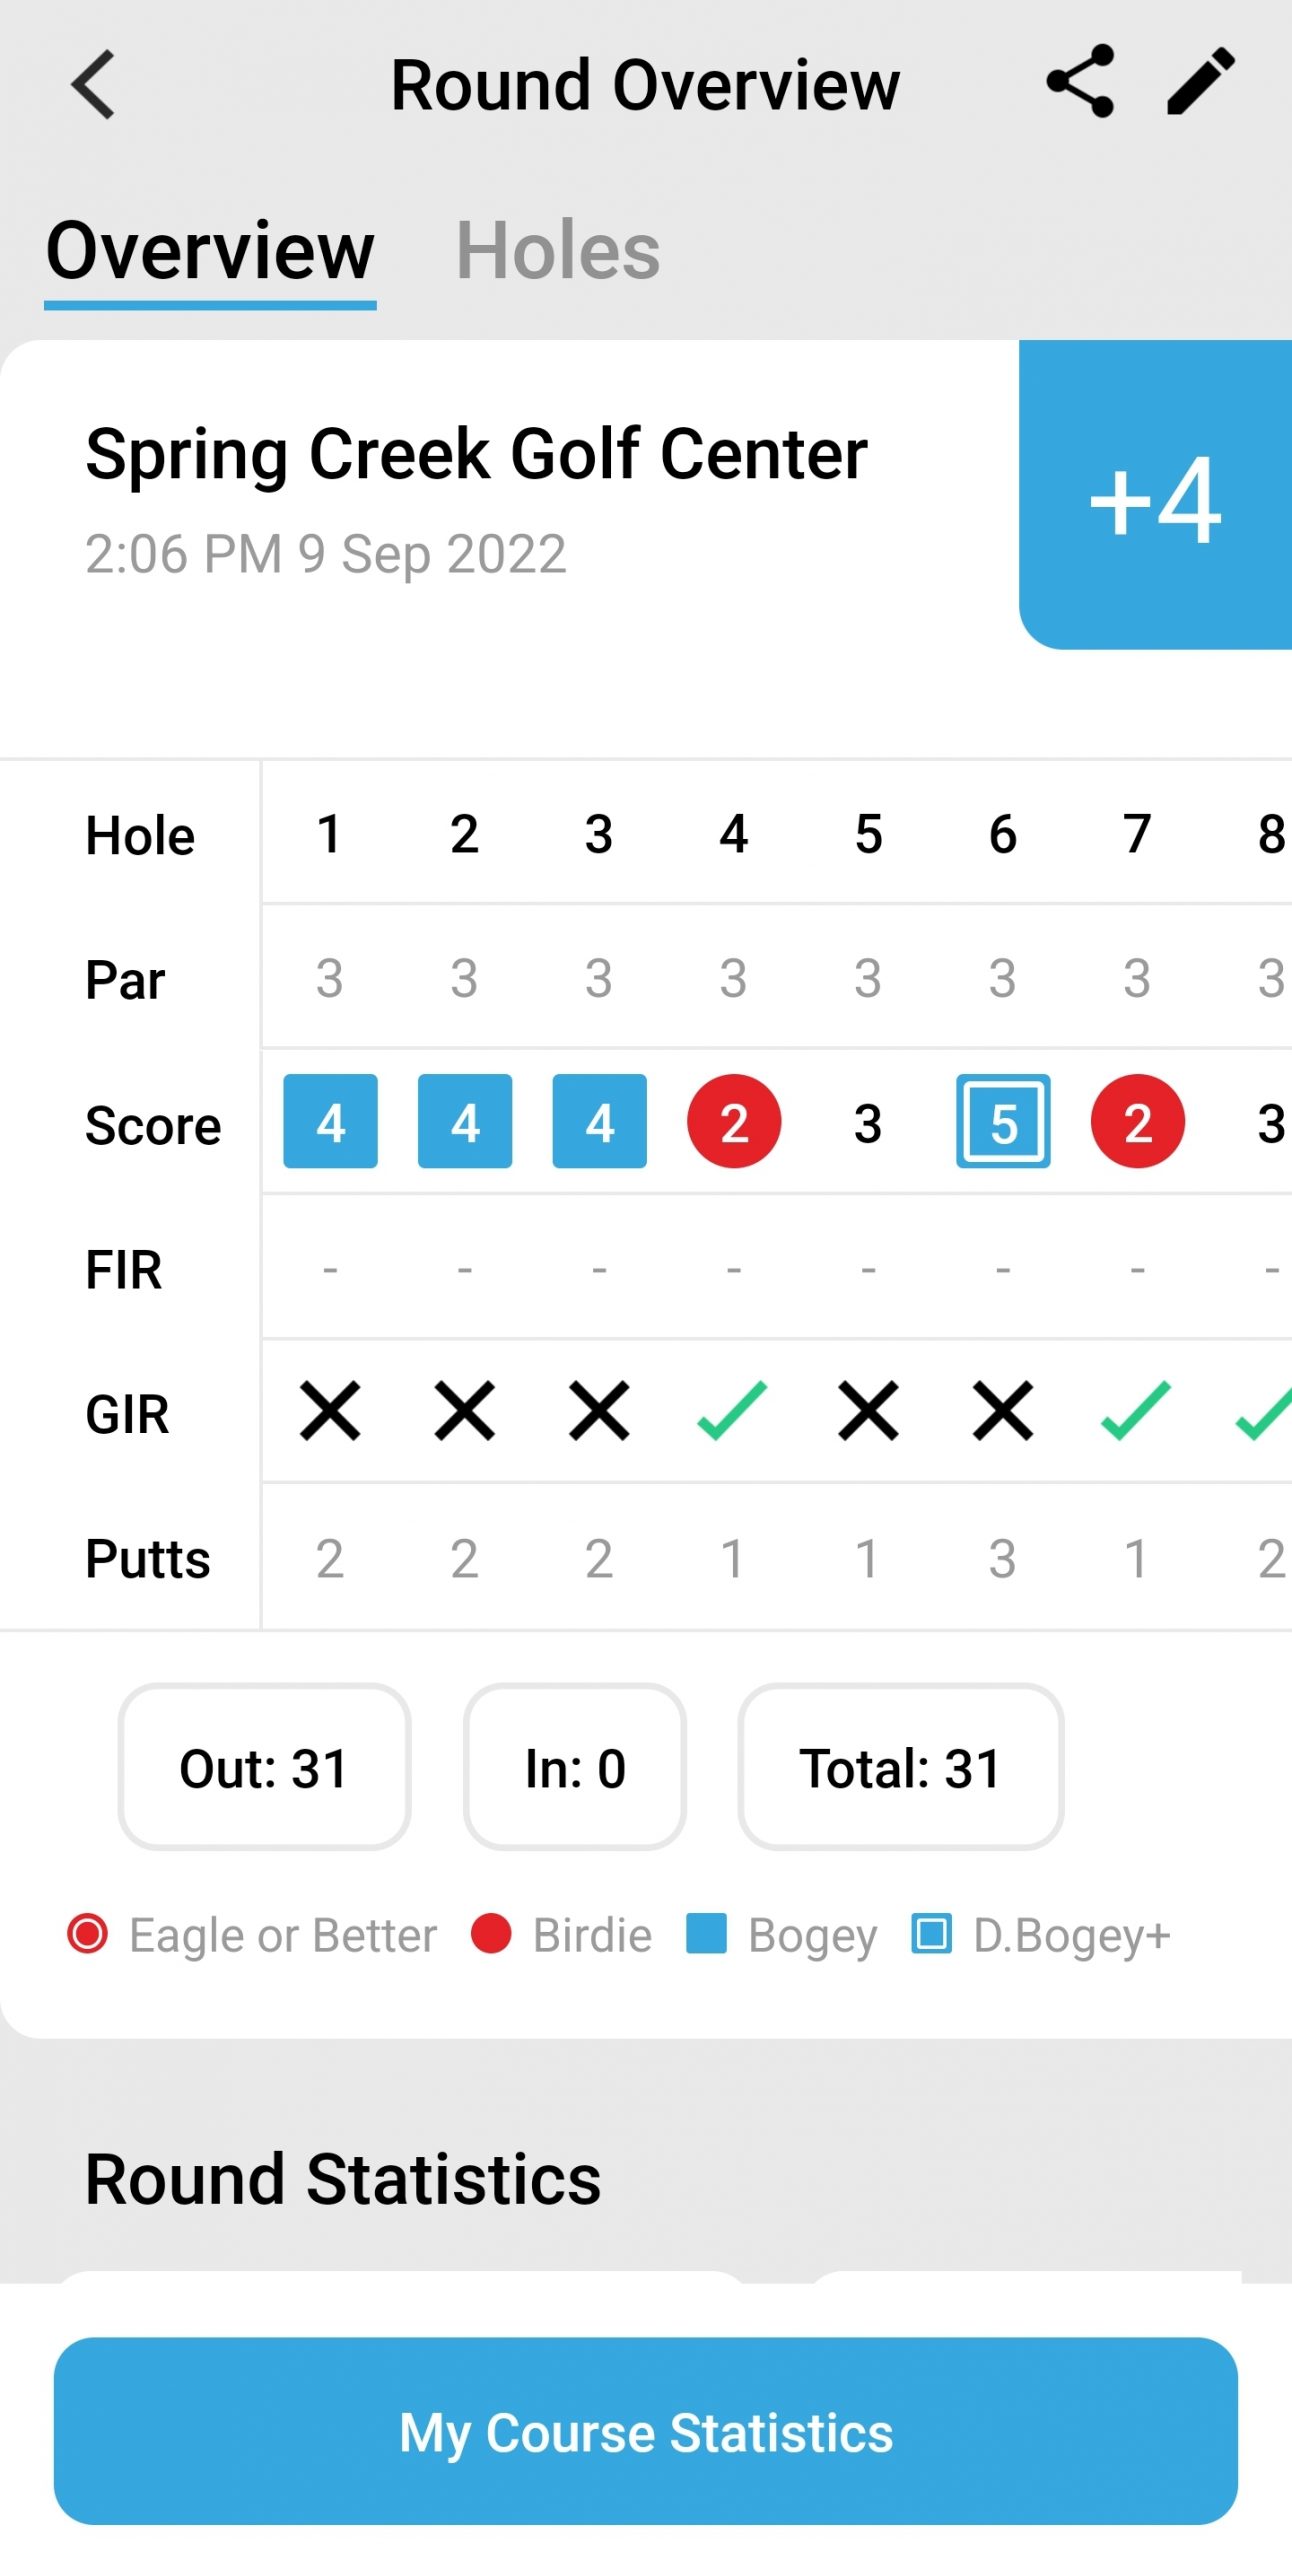
Rounds and Round Overview
Rounds are listed by year played.
Over 36,000 courses mapped.
(Note: You must choose what course you are playing before you start and what tees you are playing)
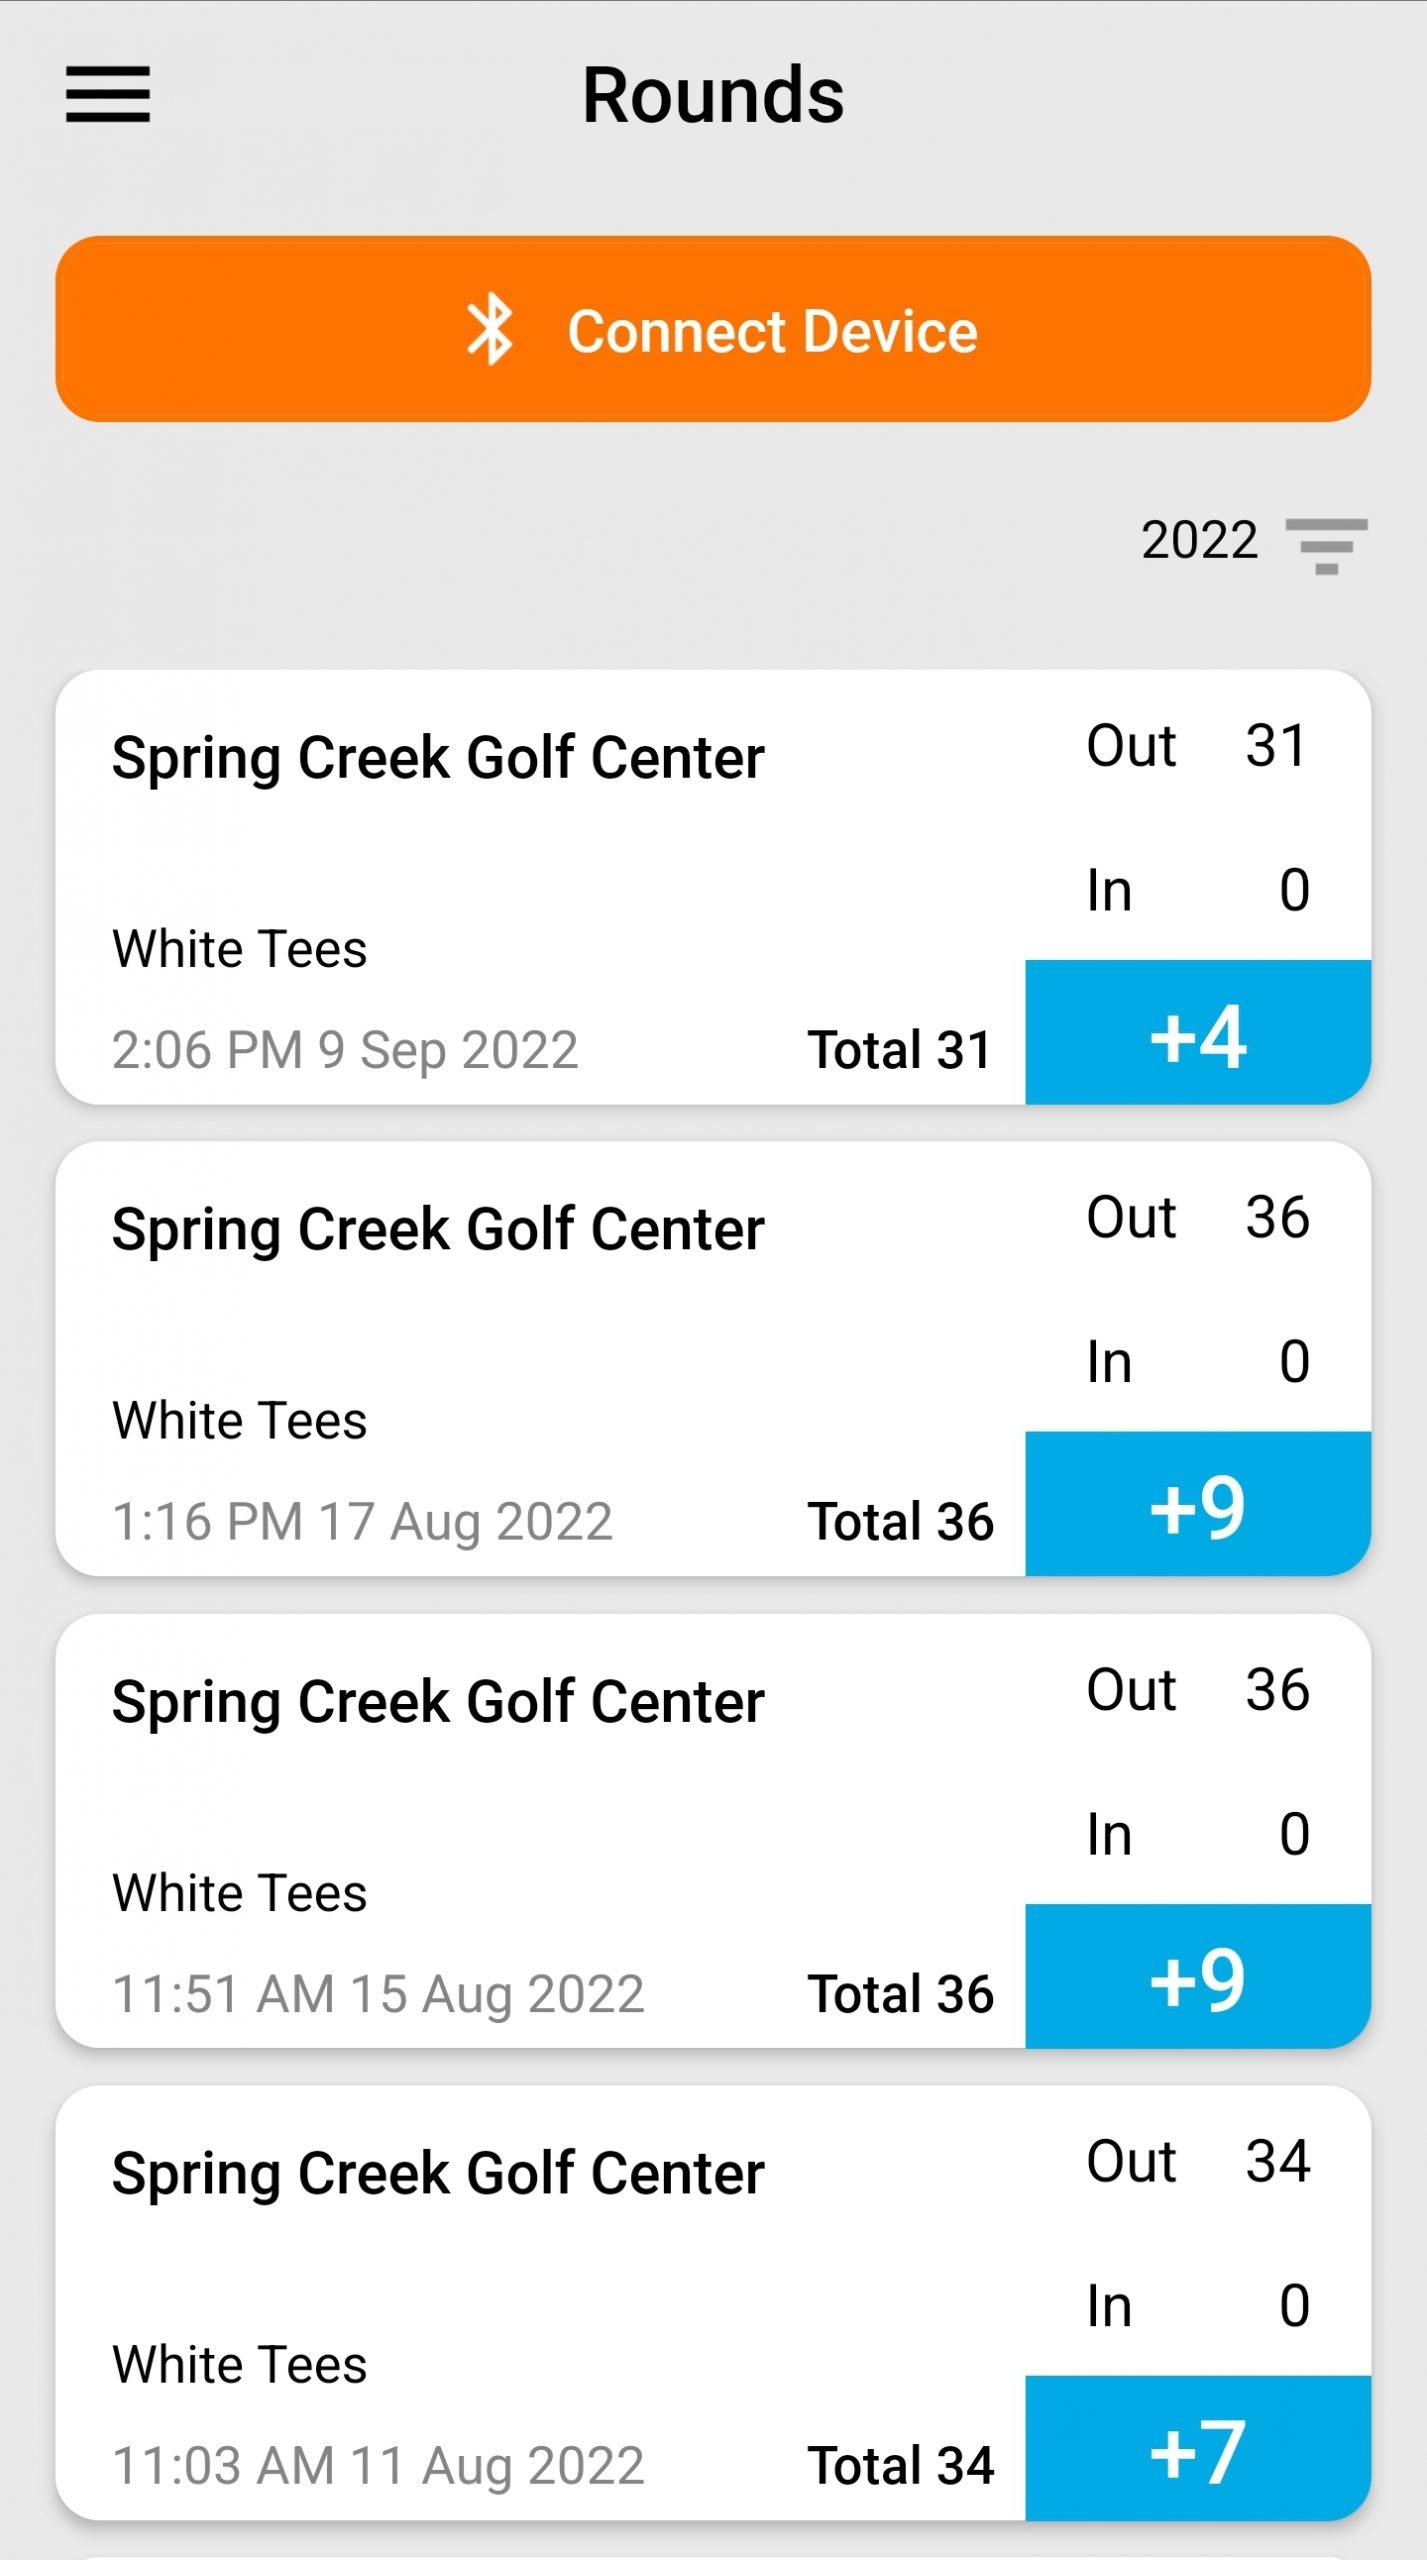
The round overview is like a score card. In Holes view you can view individual holes.
You can also edit as needed. Most often putts or hole locations are edits I make. I’m guessing if you are too quick the GPS doesn’t pick up the location right away.
Another situation I’ve had is where I forgot to click on PiN COLLECT when finishing the hole. In that case, you can manually adjust where the pin was, move shot locations, or add / delete shots.
PIN COLLECT is all you really need to do while you are playing. Just click the proper button at the pin and it knows you are done playing the hole.
Note: They recently added MY COURSE STATISTICS at the bottom of this image. It is another break down of your stats by hole and skill for your main course. They rank the holes based on your scores over time. I left out photos from that or this would be longer than it already is.