
How does the degree or percent of slope figure into the effective stimp of a putt? It’s a significant factor. Let’s take a look at ways to measure it.
There are two ways to view slope. That would be in degrees or as a percent. I personally prefer to measure in degrees as that was part of my job before I retired.
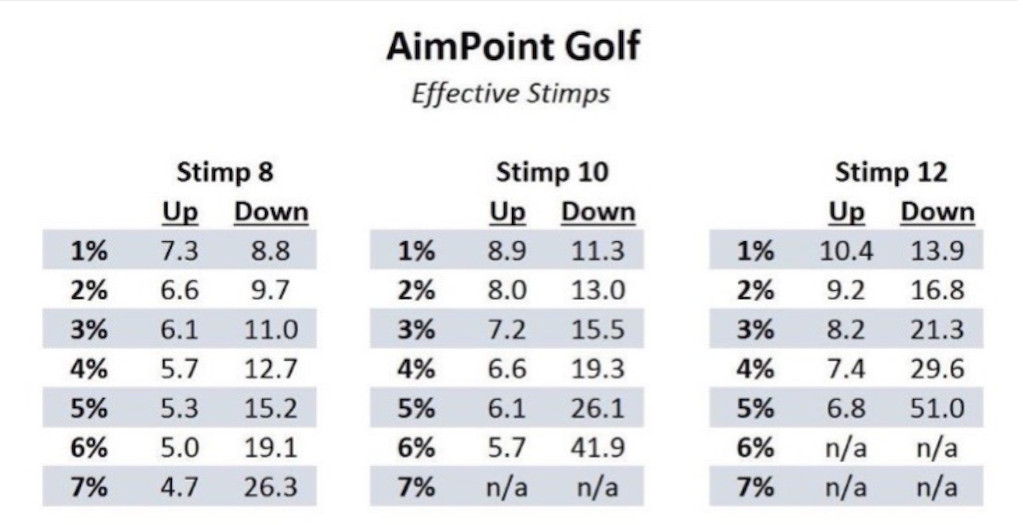
AimPoint Golf offers a method of measuring in percent of slope. You can see how much “effective stimp” and change in pace is affected in the chart below. The stimp readings are 8 (regular course and pretty slow), 10 (fast for normal play), 12 (pretty darn fast.)
I always ask what the stimp reading for greens is at the pro shop when I play somewhere.
In my mind, how you measure isn’t as important as realizing there is a significant change and being able to measure it. Use just your eyes, your eyes and holding fingers up or use your feet.
Learn to see and feel slope. The bottom line…practice uphill, downhill and breaking putts.
Ways to measure
For a regular player, making this as simple as possible should be important.
There is a time factor involved here also. I mean pace of play.
Whipping out a digital level during Monday night league will be frowned upon and not allowed.
So it’s important to be able to see what a putt is going to do in your pre-shot routine. I use my eyes and feet to see and feel the break.
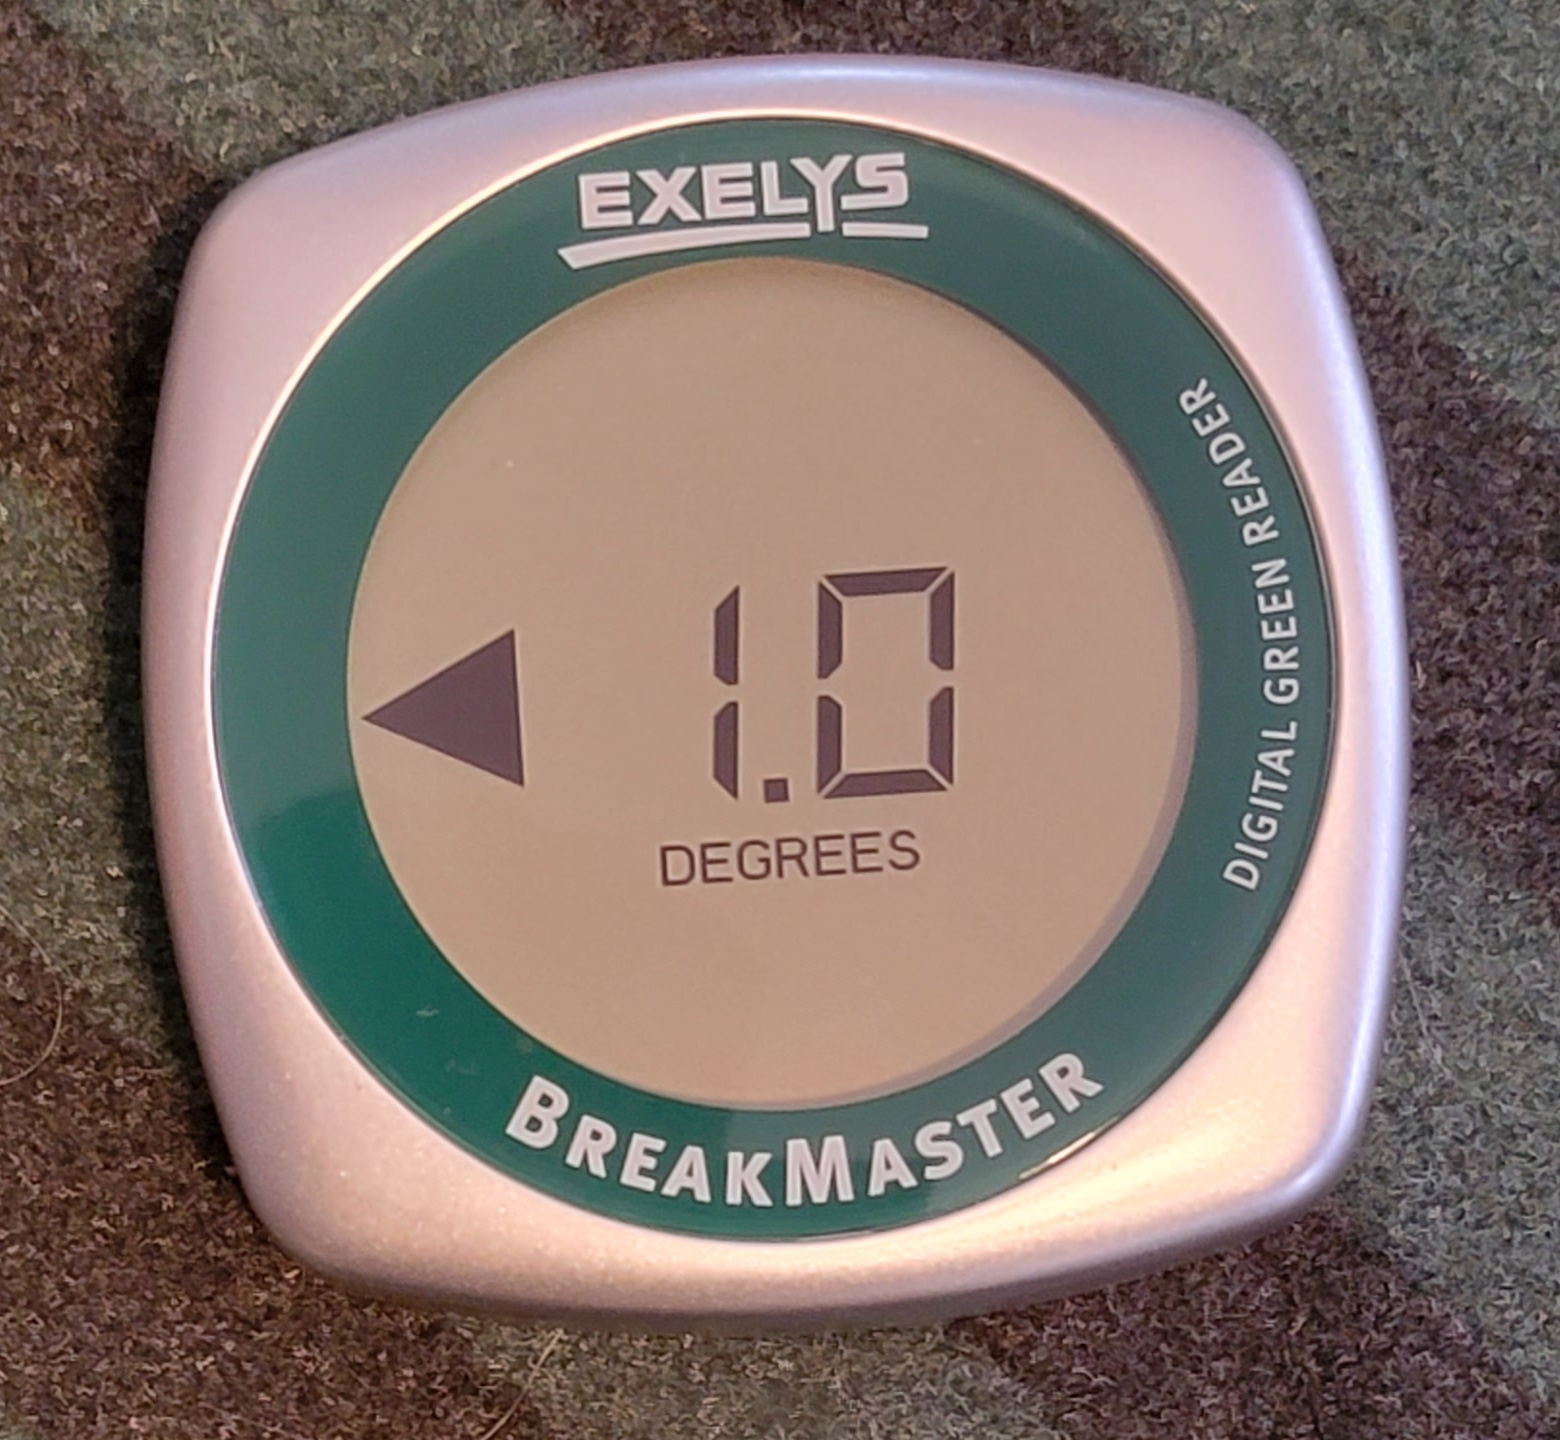
Here are some measuring options for practice from our Digital Green Reading page.
Another way to train yourself to see break on greens is to use greens books. You can buy completed greens books online for your specific course, buy a blank greens book and draw them in with a pencil or make them with a computer.
Visit our page on Mapping your course or greens. As you will see, I’ve made things Green for go, Yellow for caution and Red for stop. It can be that simple or it can be extremely detailed. I’ve done both with green maps.
Slope charts
I see slope as 1, 2, 3 or 4 degrees. To me…using percentages breaks down putts into portions of a degree and seems difficult to wrap my arms around. That’s just me. See our Putting Resources page.
On the other hand, I could make a chart in percentages of 1, 2, 3, 4, and 5 percent and say using degrees looks funny.
Make it simple.
I carry these cheat sheets in my green map / scorecard book during practice rounds. After a while, you won’t need charts or a book to see the correct amount of break or slope in degrees or percent.
Slope chart – degrees into percentage
0.5 degree = 0.85 percent
1.0 degree = 1.70 percent
1.5 degrees = 2.55 percent
2.0 degrees = 3.40 percent
2.5 degrees = 4.25 percent
3.0 degrees = 5.10 percent
3.5 degrees = 5.95 percent
4.0 degrees = 6.80 percent
Percent to Degrees
.5 percent = .29 degrees
1 percent = .57 degrees
1.5 percent = .86 degrees
2 percent = 1.15 degrees
2.5 percent = 1.43 degrees
3 percent = 1.72 degrees
3.5 percent = 2 degrees
4 percent = 2.29 degrees
4.5 percent = 2.58 degrees
5 percent = 2.86 degrees
5.5 percent = 3.15 degrees
6 percent = 3.43 degrees
6.5 percent = 3.72 degrees
7 percent = 4 degrees
Rise angle: Putting uphill or downhill
This chart is in percentage increments. Degrees of slope and percent of slope are not the same…I use these for a ball park reference. Use the suggestions in the chart to practice up and downhill putts.
So, based on your game, apply 1 time, 2 times, etc. increased pace for uphill putts and the reverse for downhill putts.
| Rise Feet | Body of 6′ Golfer | Slope | ||
| run of 100′ | run of 50′ (2x) | run of 25′ (4x) | ||
| 1′ | Halfway up shin | 1% | 2% | 4% |
| 2′ | Knees | 2% | 4% | 8% |
| 3′ | Hips | 3% | 6% | 12% |
| 4′ | Bottom of Sternum | 4% | 8% | 16% |
| 5′ | Chin | 5% | 10% | 20% |
| 5.5′ | Eyes | 5.5% | 11% | 22% |
| 6′ | Top of Head | 6% | 12% | 24% |
(This is a ballpark reference you can use walking around the green before you putt)